2020 Year in Review: A Look Back at Whales & Ships in the Santa Barbara Channel
Each year, the ocean’s giants come to the Santa Barbara Channel to feed in the rich, biodiverse waters between the Channel Islands and mainland California. And 2020 was no different—although humans were unable to travel for most of the year due to the COVID-19 pandemic, whales continued to carry out their thousand-mile migrations up and down the coast of California. In the Channel, it was a particularly busy feeding season for blue whales — usually seen alone or in small groups, aggregations of over 30 blue whales were observed in and around the Channel Islands National Marine Sanctuary this past year.
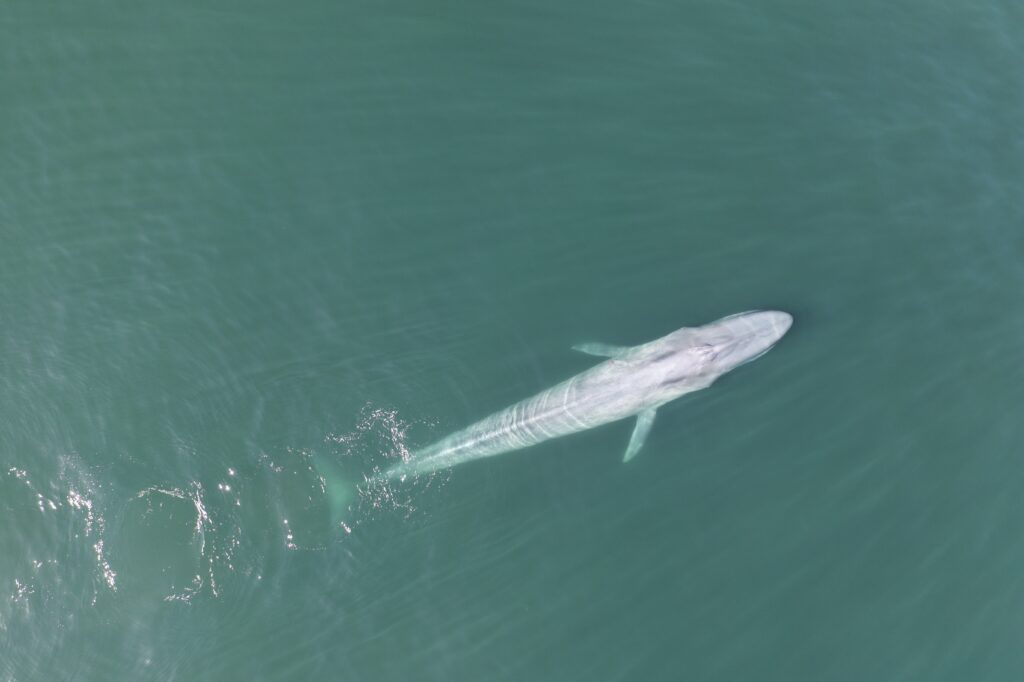
Photo Credit: Elliott L. Hazen, NMFS Permit 16111
In addition to being a biodiversity hotspot and important feeding ground for endangered whales, the Santa Barbara Channel is also home to an international shipping route that hosts thousands of vessel transits each year. This overlap of whale & ship activity leads to an elevated risk of ship collisions with endangered whales.
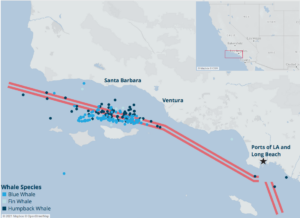
International shipping lanes traverse important whale habitat in the Santa Barbara Channel, leading to an elevated risk of whale-ship collisions. Whale sightings were collected via the Whale Alert and Spotter Pro apps in the Santa Barbara Channel from May 15 – December 15, 2020.
Whale Safe is a technology-powered mapping and analysis tool displaying near real-time whale and ship data for the Santa Barbara Channel, with the goal of reducing the risk of fatal ship collisions with endangered whales. The tool displays both visual and acoustic whale detections, as well as a dynamic blue whale habitat model that updates daily based on oceanographic conditions. Each day, these three whale data sources are combined into an integrated whale presence rating (low, medium, high, very high) for the Santa Barbara Channel.
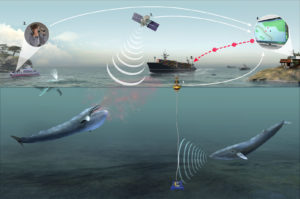
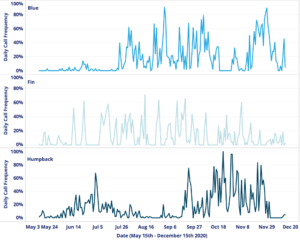
Whale Safe incorporates three near real-time whale sensing technologies. 1) Acoustic monitoring system identifies blue, humpback, and fin whale vocalizations. 2) Observers record whale sightings aboard whale watching boats or aircraft with the Whale Alert mobile app. 3) Oceanographic data is used to predict where blue whales are likely to be each day, based on known habitat preferences. 4) The three near real-time whale data streams are compiled and validated. 5) Whale information is disseminated to industry, managers, and the public
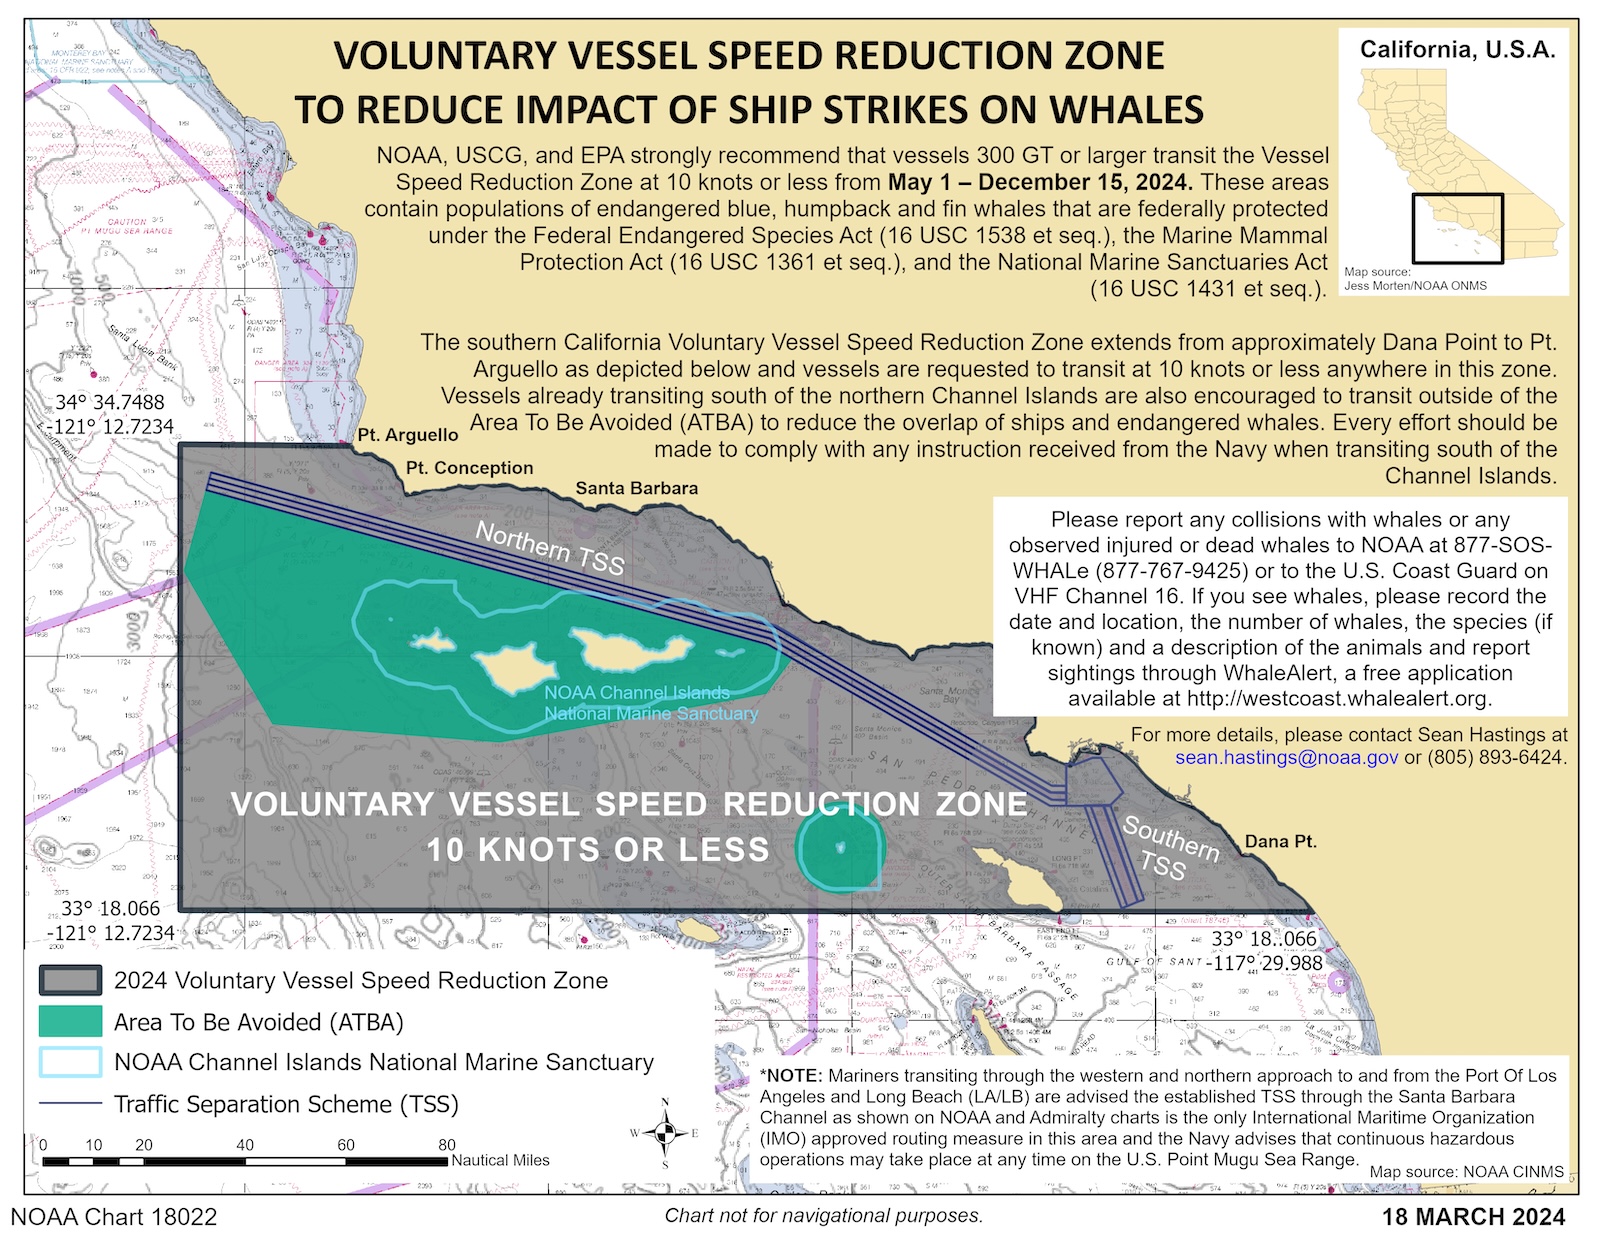
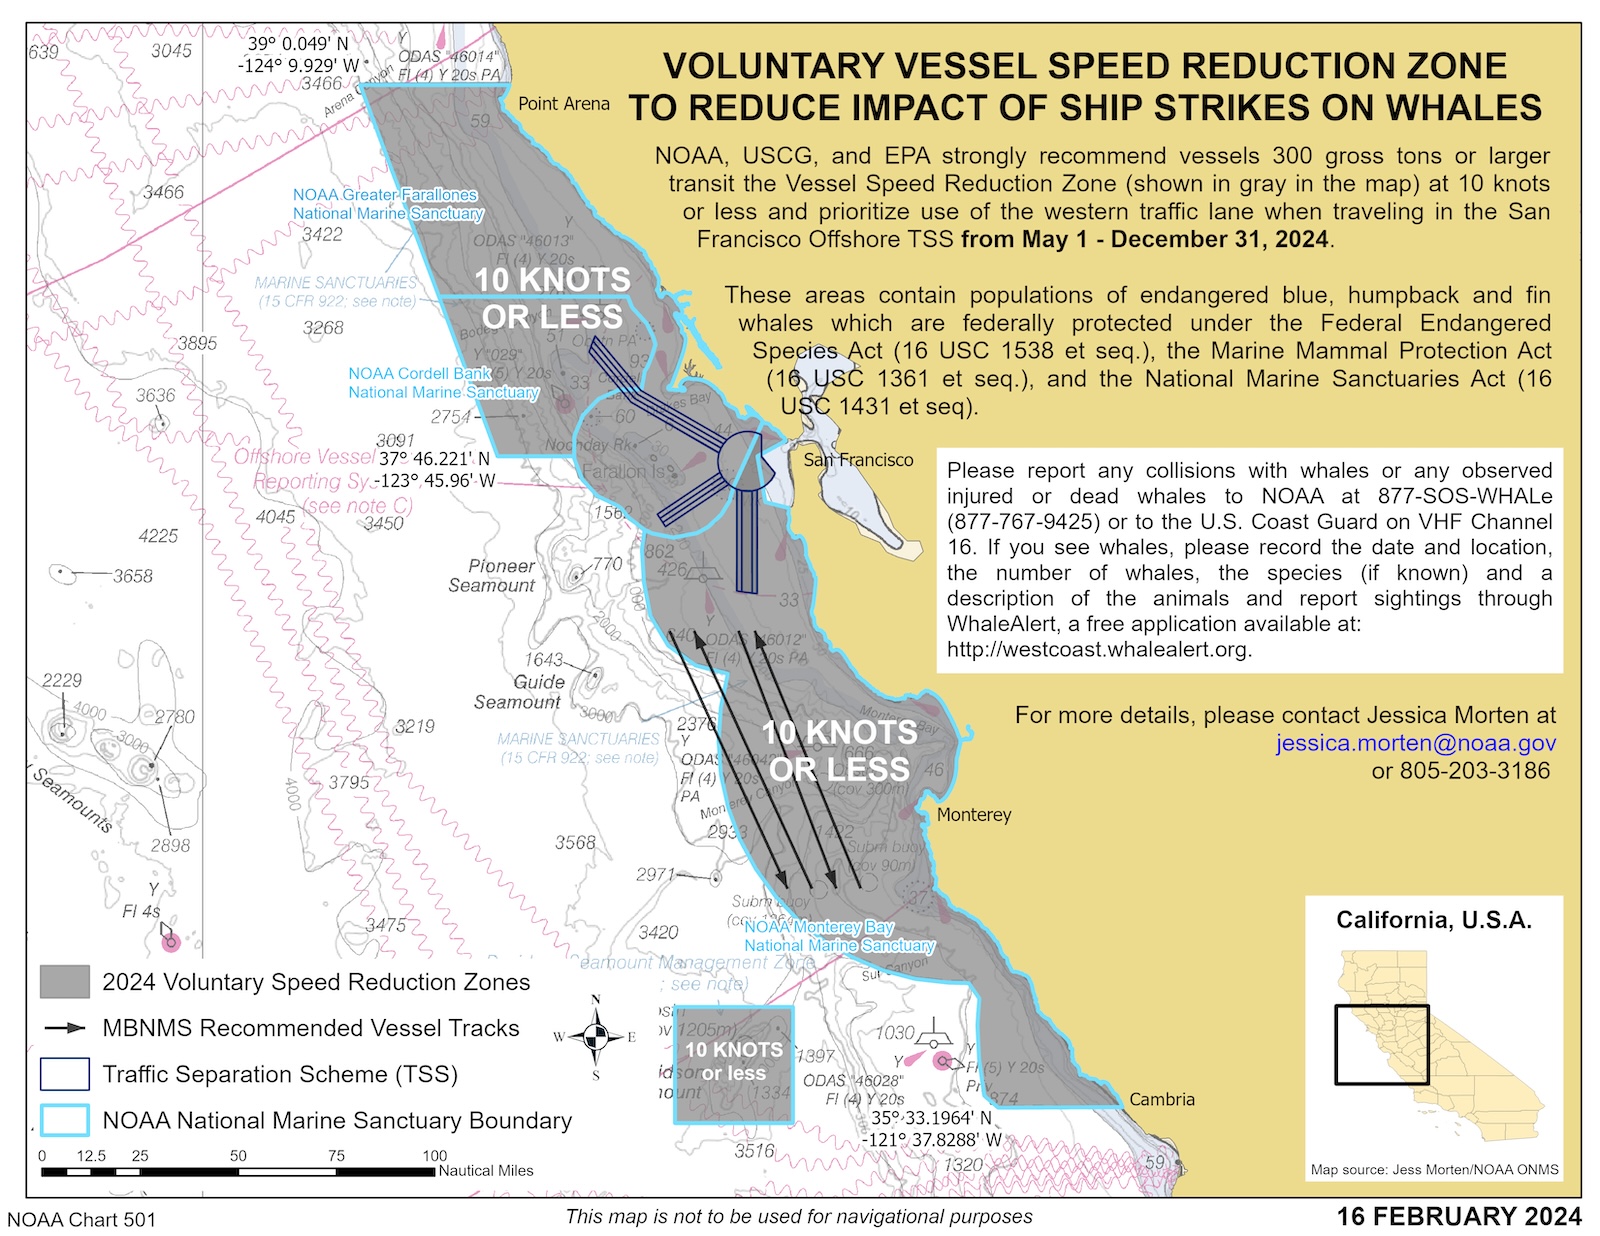
Research has shown that in busy coastal areas, slower ships save whales. NOAA and the Coast Guard implement seasonal, voluntary speed limits for large ships in the Santa Barbara Channel region to help protect endangered whales.
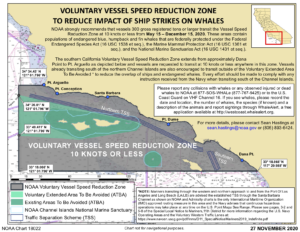
NOAA and the Coast Guard implemented a 10 knot voluntary speed limit for large ships transiting the region from May 15 – December 15, 2020. This notice is sent to vessels via the Coast Guard Local Notice to Mariners.
Summary of Whale Safe Data for May 15 – December 15, 2020
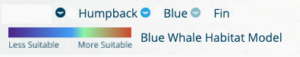
Video displays a daily summary of Whale Safe data. The underlying colors show the habitat suitability for blue whales, with warmer colors indicating more suitable habitat conditions. Whale sightings are shown with whale tail icons, and acoustic detection frequency is shown in the top right corner.
One of the data inputs of Whale Safe, the blue whale model (shown above as the underlying change in color) predicts habitat suitability for blue whales on a daily basis using near real-time oceanographic data like sea surface temperature and currents. In 2020 we saw the predictive power of the model as it forecasted high habitat suitability during the summer months, as the productive Santa Barbara Channel attracted plentiful krill, a favorite food source for blue whales. The model was developed by scientists at the University of Washington, UC Santa Cruz, and NOAA’s Southwest Fisheries Science Center. Read more about it here.
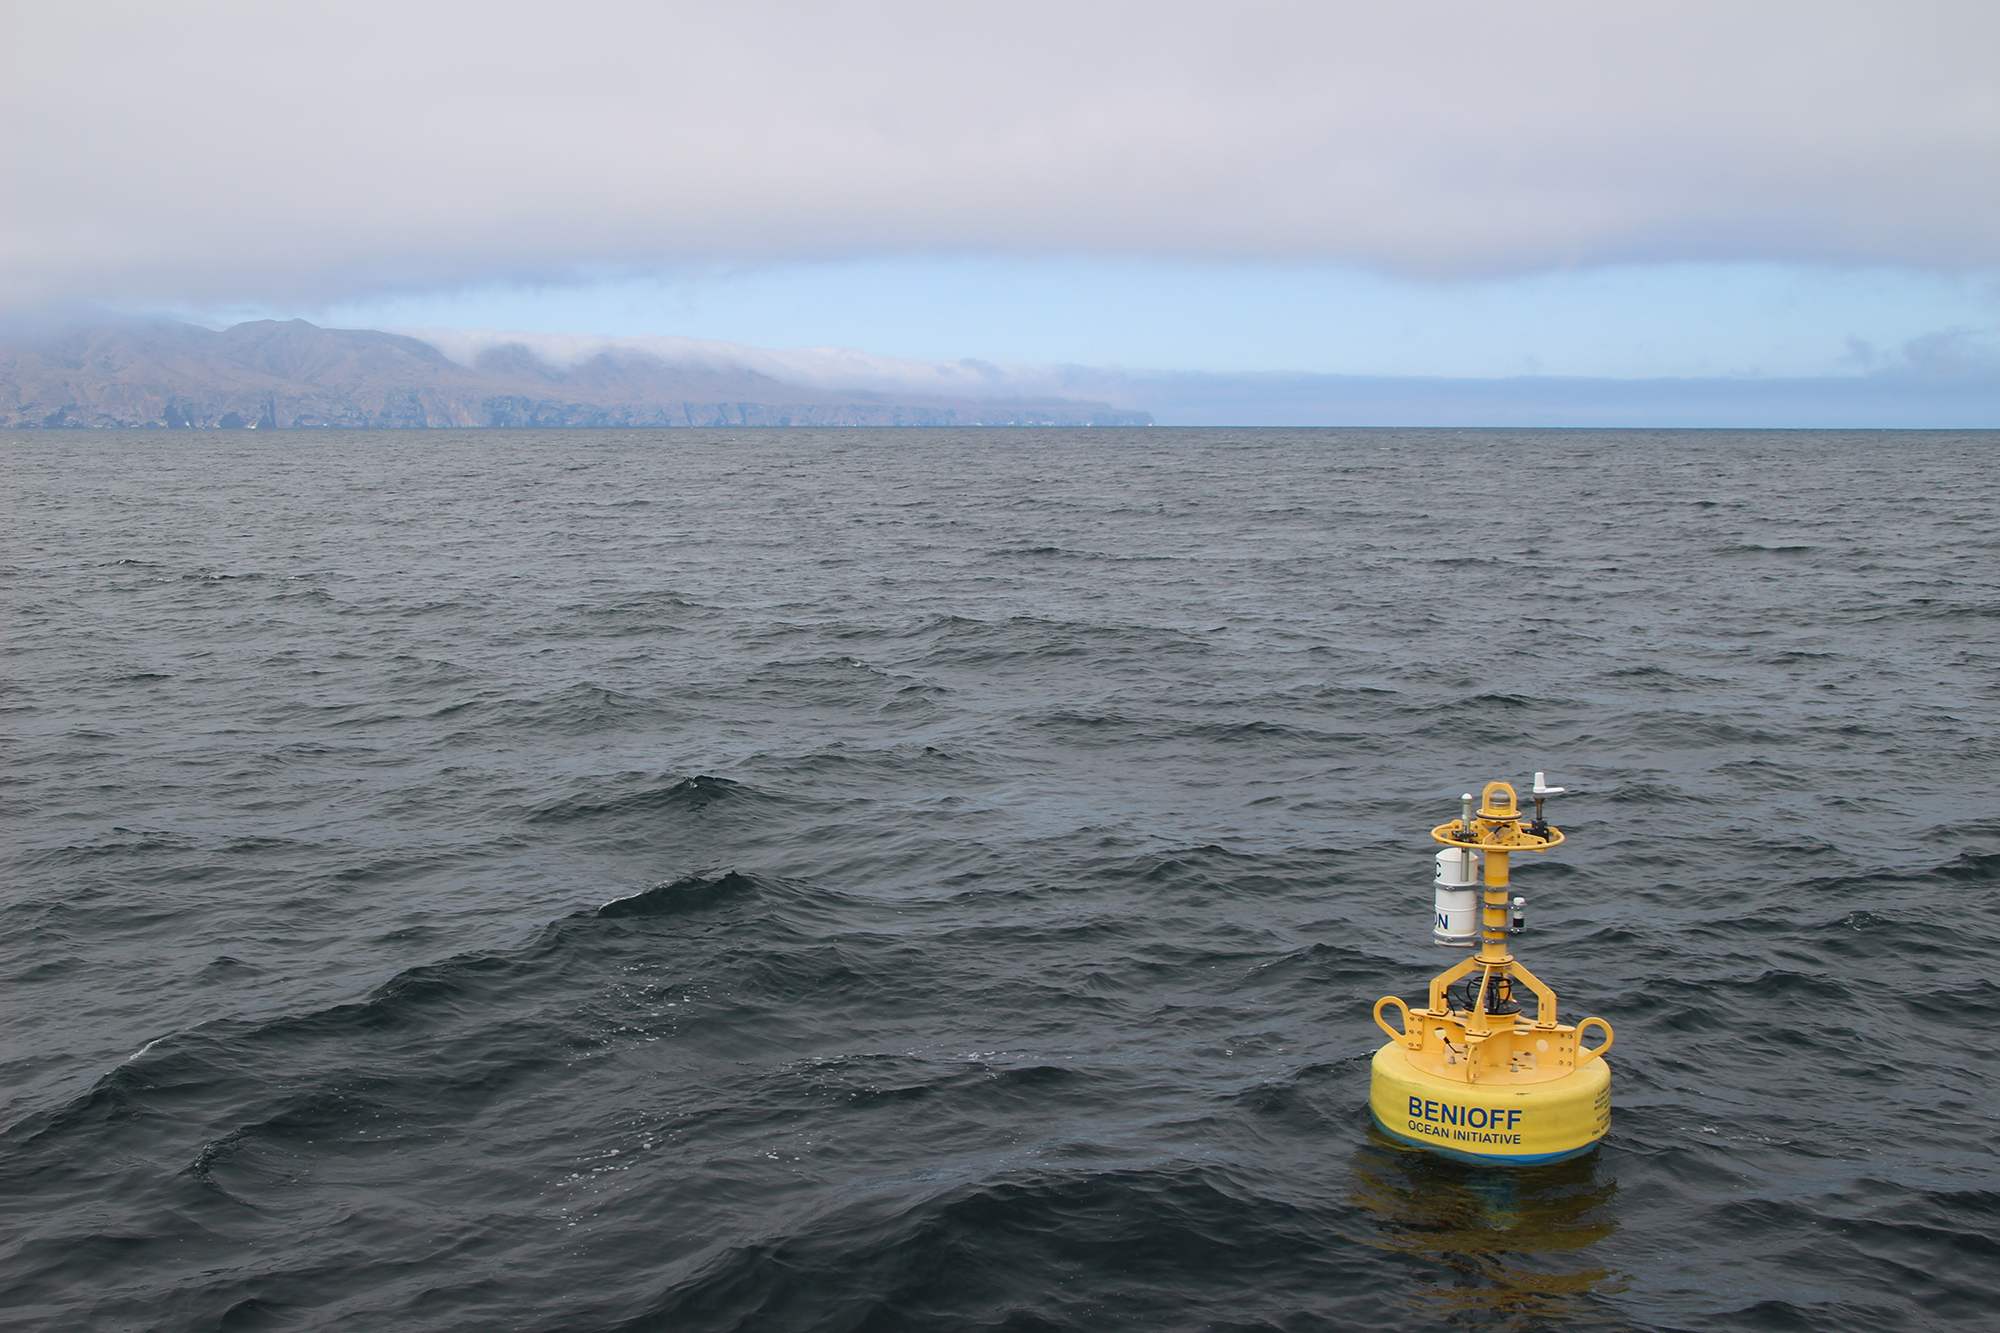
Real-time passive acoustic monitoring buoy listens for whales in the Santa Barbara Channel.
The near real-time acoustic buoy that is deployed out in the Channel uses a hydrophone (underwater microphone), AI-powered computer, and satellite transmitter to send back acoustic detections of blue, humpback, and fin whales in near-real time. The acoustic buoy confirmed that it was a busy year for blues, with blue whale acoustic detections coming in every day from mid-July through mid-October. Blue whales weren’t the only endangered species enjoying the Channel this year. Humpback and fin whale vocalizations were also consistently picked up by the acoustic buoy throughout the year.
Acoustic data provided by Woods Hole Oceanographic Institution and Texas A&M University at Galveston. Read more about the acoustic technology used in this system here.
Out of the 215 days that the vessel speed reduction zone was in effect, the Whale Presence Rating was “Very High” for 173 days and “High” for 42 days. This was due to the consistently high frequency of acoustic detections and whale sightings, as well as model predictions showing of highly suitable habitat for blue whales. NOAA extended the dates of the slow-down recommendation for an extra month through December 15th (original end date Nov 15th) to provide additional protection as high whale activity persisted later into the year than usual.
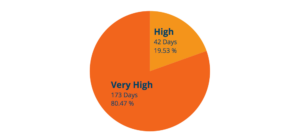
During the time period when the vessel speed reduction zone was in effect (May 15 – Dec 15, 2020), the data-driven Whale Presence Rating was consistently high or very high.
Usually the Channel Islands Naturalist Corps, a group of specially trained citizen scientists, collect whale sightings with the Spotter Pro mobile app while aboard whale watching and tourism vessels in the Santa Barbara Chanel. Unfortunately, due to COVID-19, the Naturalist program was on hold in 2020. Thankfully, captains and crews of local whale watching boats (special thanks to Captain Beezer of the Condor Express!) stepped in and helped to collect whale sightings data when they could. Additional whale sightings came in thanks to The Volgenau Foundation, who funded a handful of flights over the shipping lanes. Although this data was limited in 2020 compared to previous years, the sightings they were able to collect complemented the acoustic detections and model data to provide a more holistic view of whale activity in the Channel.
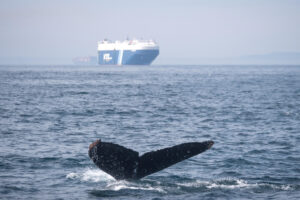
Photo Credit: Adam Ernster
Summary of Ship Data for May 15 – December 15, 2020
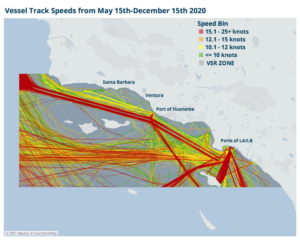
In addition to monitoring whales, Whale Safe also has a reporting system that summarizes ship tracking data to determine which vessels and companies best abide by the voluntary speed limits implemented by NOAA and the Coast Guard. In 2020, the voluntary vessel speed reduction zone was in place in Southern California from May 15 – December 15, requesting that large vessels (over 300 gross tons) transit the zone at speeds of 10 knots or less. During this time period, 941 large vessels traversed the region, transiting a total of 634,366 nautical miles. Many vessels transited the zone multiple times, going to and from the Port of Los Angeles, Port of Long Beach and Port of Hueneme. Overall, large vessels had a cooperation rate of 54% with the 10 knot voluntary speed limit.
Top 10 Shipping Companies by Fleet Transit Distance for 2020
| Operator | Distance (nm) | Grade |
|---|---|---|
| Maersk A/S | 37,210 nm | C (55.4%) |
| Ocean Network Express Pte Ltd | 36,062 nm | D (29.2%) |
| COSCO Shipping Lines Co Ltd | 30,493 nm | B (61.1%) |
| Evergreen Marine Corp | 23,960 nm | C (48.2%) |
| MSC Mediterranean Shipping Co | 19,598 nm | A (90.1%) |
| Hapag-Llyod AG | 15,725 nm | B (79.3%) |
| Chevron Shipping Co LLC | 15,513 nm | B (77.9%) |
| HMM Co Ltd | 14,189 nm | F (19.0%) |
| CMA-CGM SA The French Line | 13,910 nm | B (69.8%) |
| APL LLC | 13,573 nm | C (58.2%) |
New Communication Channels Available
Whale Safe data is accessible through the web interface, as well as automated email alerts. You can sign up for daily or weekly whale data updates, or monthly shipping data updates, on the get involved page. We have also recently developed two new ways to access near real-time whale data: an automated twitter feed (@whalesafe_ca) and an Application Programming Interface (API), which allows vessels to pull data directly into their communication systems for convenient use and display. To learn more about the API, email boi-whalesafe@ucsb.edu.