Methodology
Overview
Whale Safe is a technology-powered mapping and analysis tool displaying near real-time whale and ship data designed to prevent fatal ship collisions with endangered whales. Whale Safe operates across three regions along the California coast: the Santa Barbara Channel, offshore San Francisco, and within San Francisco Bay. Each region uses a tailored combination of detection technologies suited to its environment. In the shipping lanes in the Santa Barbara Channel and offshore San Francisco, the tool combines acoustic detections, visual observations, and a blue whale habitat model into an integrated Whale Presence Rating (low, medium, high, very high). Within San Francisco Bay, the tool uses thermal camera detections and visual observations to assess whale presence.
In addition to sharing whale data, the tool displays internationally designated shipping lanes, voluntary vessel speed reduction zones, and shipping activity that is derived from Automatic Identification Systems (AIS). The tool summarizes AIS data to determine which vessels and companies best abide by voluntary speed recommendations that are put in place to protect endangered whales along the California coast.
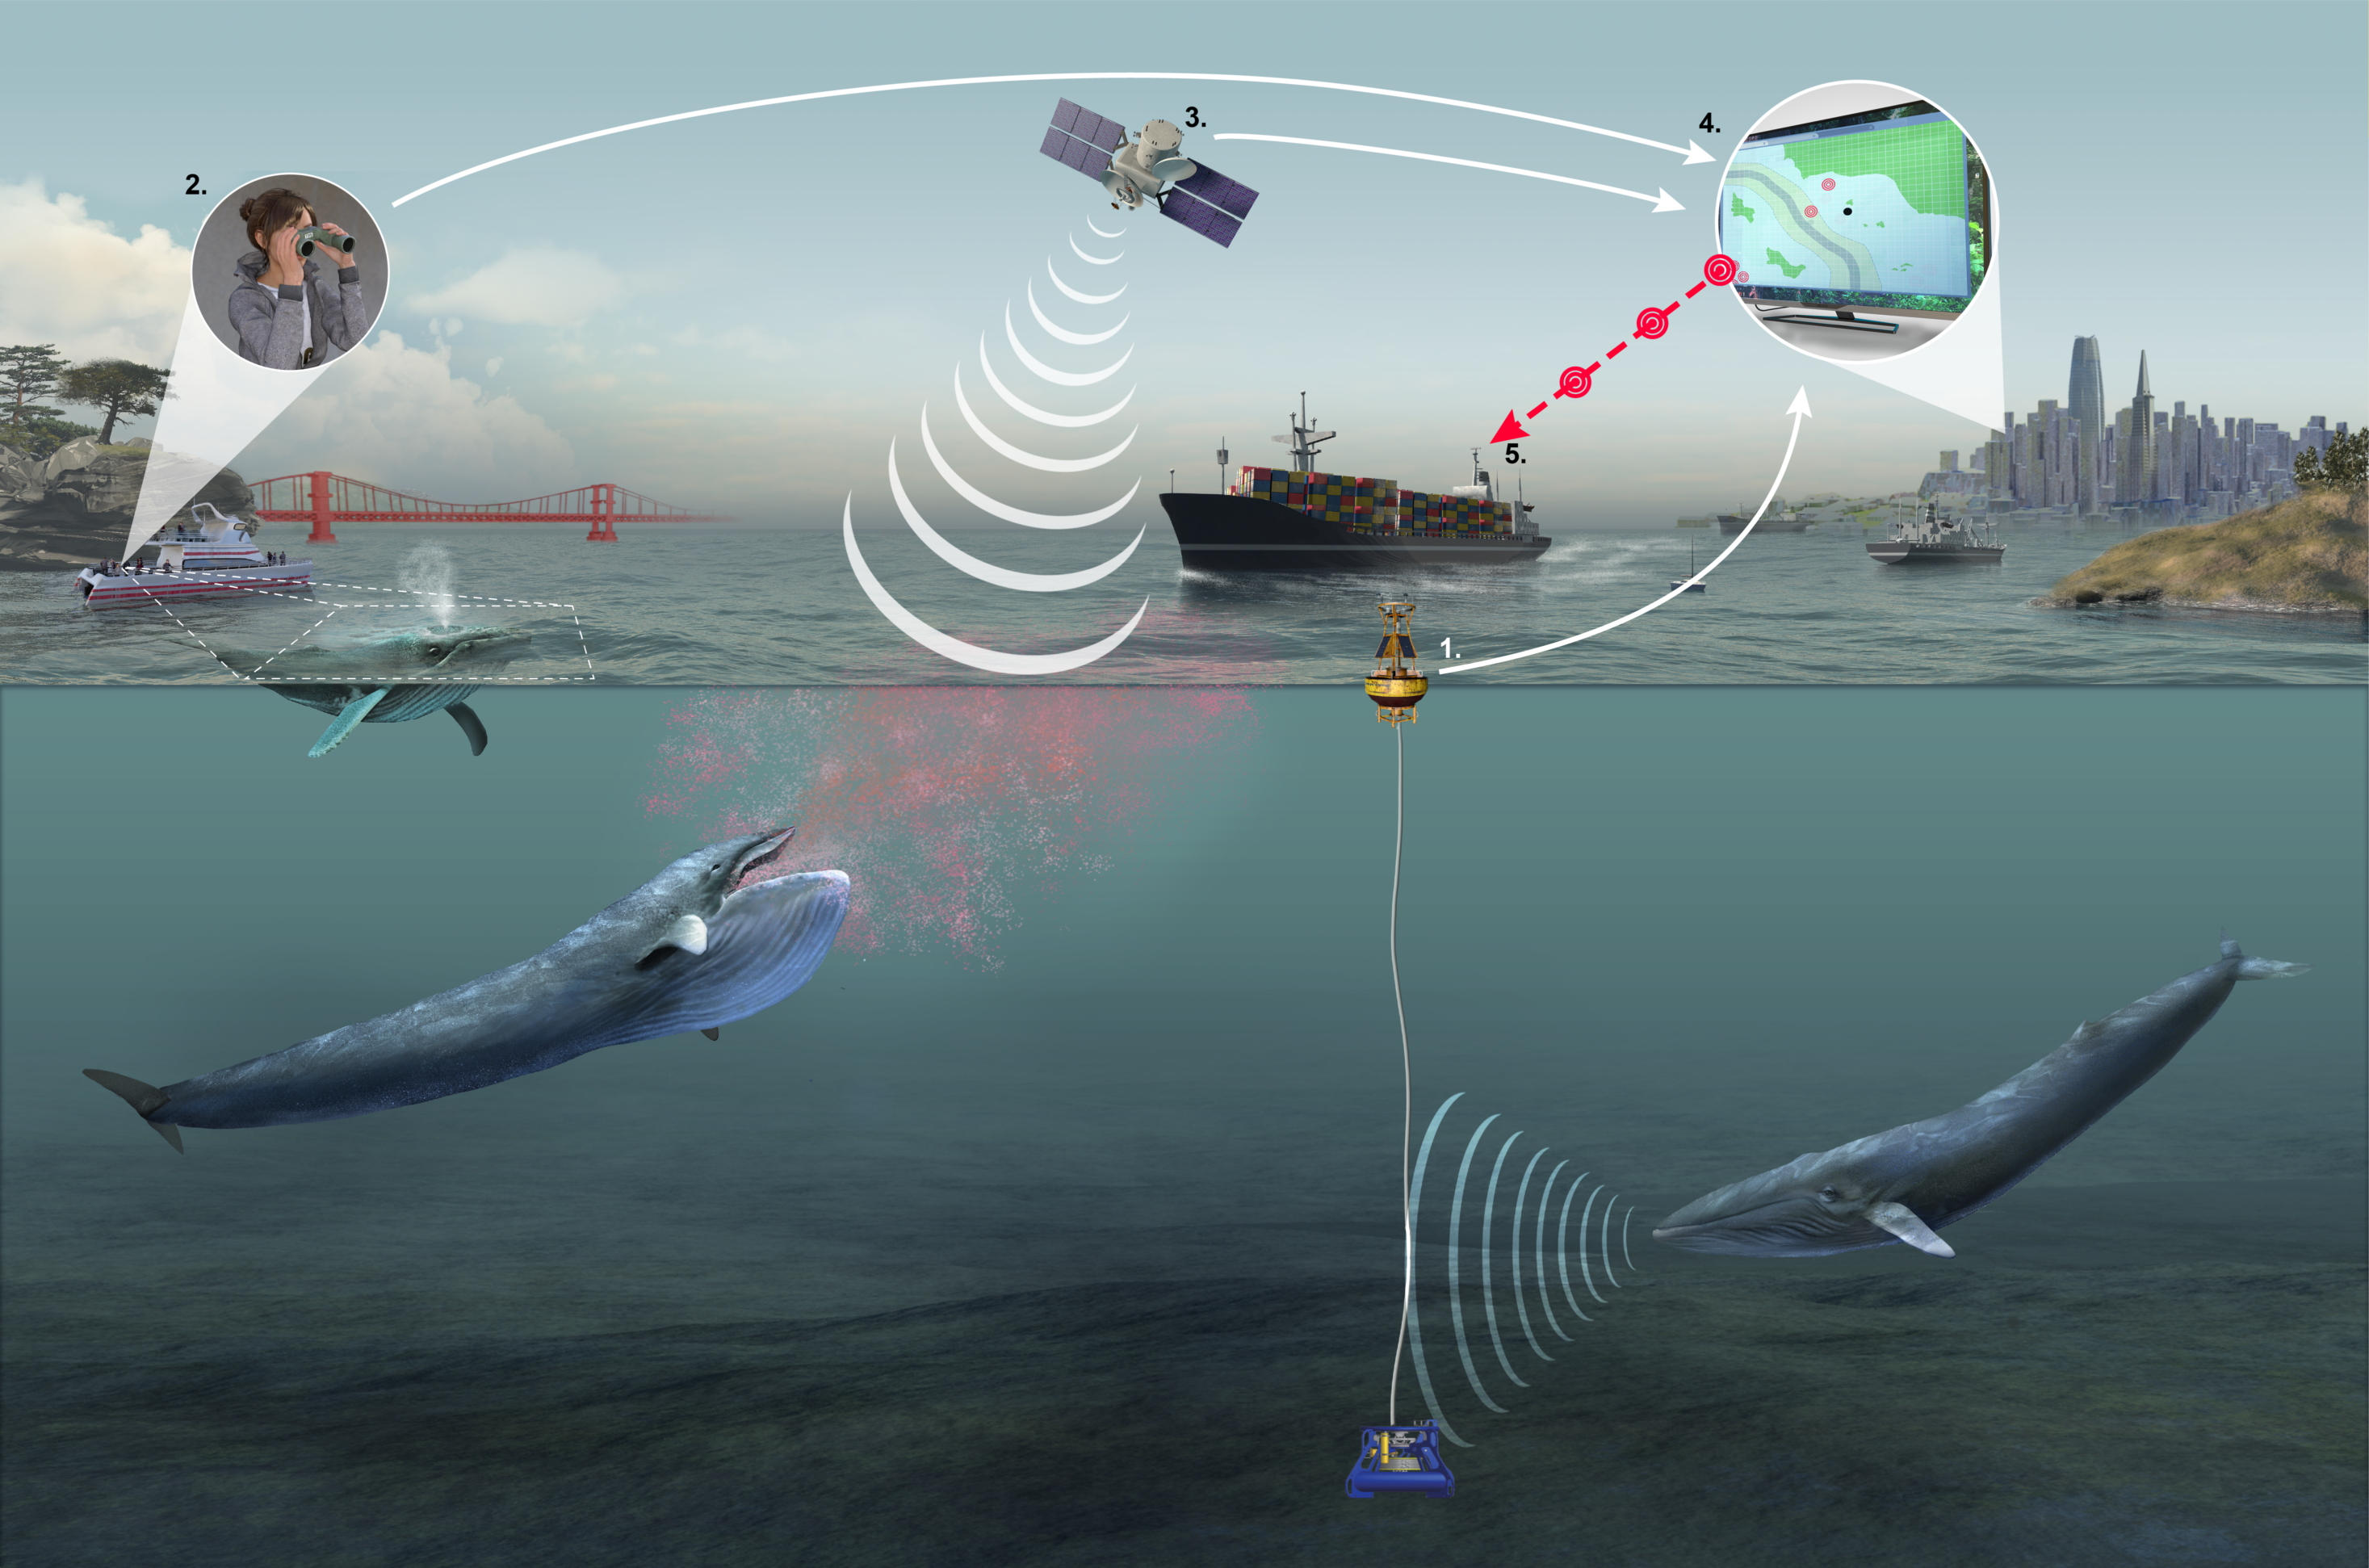
- Acoustic monitoring instruments identify blue, humpback, and fin whale vocalizations
- Trained observers record whale sightings aboard whale watch and tourism boats or aircraft with a mobile app
- Oceanographic data is used to predict where blue whales are likely to be each day, based on known habitat preferences
- The three near real-time whale data streams are compiled and validated
- Whale information is disseminated to industry, managers, and the public
Assessing Whale Presence – California Coast
This section describes the methodology used in the Santa Barbara Channel and offshore San Francisco regions. Both regions use the same types of data: acoustic detections, visual observations, and a blue whale habitat model. By combining three near real-time data sources, we can determine a relative assessment of whale activity at a given time. This tool is able to show when blue, humpback, and/or fin whales are present and have been recorded (either through visual observation and/or audio detection of their calls). It is also able to show when blue whales are likely to be in the region given the current oceanographic conditions. The tool is unable to determine when whales are definitely not present as not all whales will be seen and recorded, and not all whales vocalize, or vocalize within range of the acoustic detection buoy.
Acoustic Detection Data

What It Means: Acoustically detecting a blue, fin, or humpback whale call in the vicinity of the buoy indicates the presence of one or more whales of the species detected (blue, humpback, or fin).
What It Doesn’t Mean: Not all whales actively vocalize, so the absence of a detection doesn’t necessarily indicate that no whales are present. The buoy does not provide information on the exact location or numbers of whales present.
How It Works: The acoustic buoy uses a hydrophone (underwater microphone) and a tiny computer to detect and identify sounds in the water. Information about detected sounds are transmitted via satellite to scientists who review this information to determine if any of the sounds are whale calls and, if so, what species produced the calls. Because these calls travel differently as conditions change underwater and whales communicate at different pitches and volumes, sounds detected from the buoy cannot be used to determine how many whales are present or how far away or in what direction the whales are from the buoy.
More information about the buoy is available here:
- Baumgartner, Mark F., Julianne Bonnell, Sofie M. Van Parijs, Peter J. Corkeron, Cara Hotchkin, Keenan Ball, Léo-Paul Pelletier, et al. 2019. “Persistent near Real-Time Passive Acoustic Monitoring for Baleen Whales from a Moored Buoy: System Description and Evaluation.” Methods in Ecology and Evolution 10 (9): 1476–89. https://doi.org/10.1111/2041-210X.13244.
- Robots4Whales: http://robots4whales.whoi.edu/
Visual Observation Data
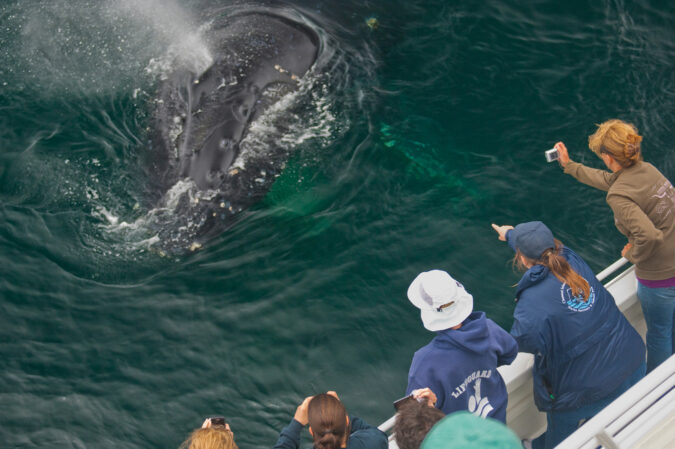
What It Means: Direct whale sightings by trained naturalists that are land-based and aboard vessels and surveyors on airplanes can confirm there are whales present. When whales are sighted, observers record date, time location, the number sighted, and species (if known).
What It Doesn’t Mean: Surveys aren’t constant and aren’t guaranteed to cross paths of all the whales in the regions, so a lack of sightings does not necessarily indicate that there are no whales present
How It Works: Naturalists and guides routinely cross the Channel and San Francisco region aboard whale watching and tourism boats, as well as land-based locations looking for whales and opportunistically recording any marine mammals sighted. When whales are spotted, their location, species, and behavior are recorded with the Whale Alert and Spotter Pro mobile apps and are transmitted to a database when the boat returns to dock. These observations are also combined with data collected during monthly aerial surveys of the Santa Barbara Channel shipping lanes. Surveys are planned to be flown monthly from 2017-2022. The flight schedule is still to be determined for 2023. For each survey flight, two transects are flown that cover a distance of approximately 180 nautical miles and follow the north and southbound Santa Barbara Channel Traffic Separation Scheme (TSS) from Oxnard to Pt. Arguello.
More information about whale sightings is available here:
- Sanctuary SIMoN Channel Islands Naturalist Corps: https://sanctuarysimon.org/dbtools/project-database/index.php?ID=100415
- Sanctuary SIMoN Channel Islands Aerial Monitoring: https://sanctuarysimon.org/dbtools/project-database/index.php?ID=100512
- Whale Alert: http://www.whalealert.org/
Blue Whale Habitat Model Data
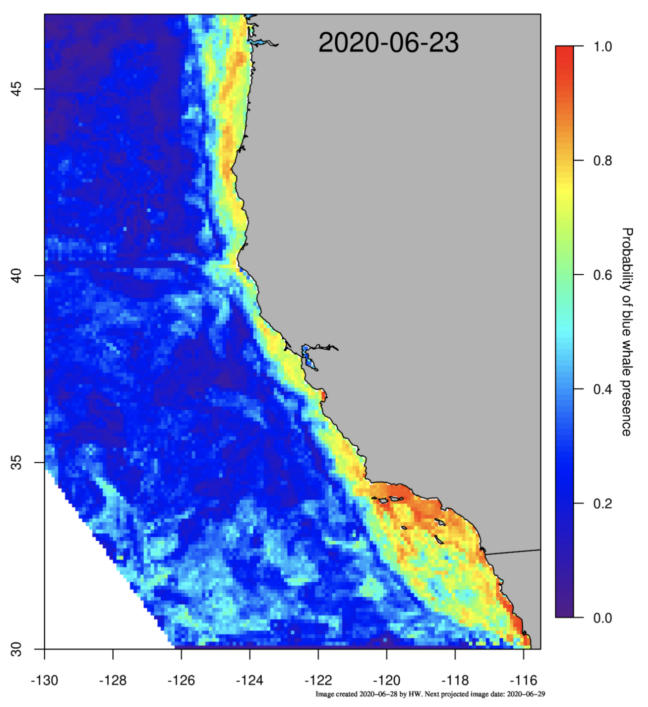
What It Means: The blue whale model displays the predicted habitat suitability (0-100%) that indicates whether blue whales are likely to be present in each 10km x 10km grid cell for the Santa Barbara Channel region, given the current oceanographic conditions. High suitability predictions are very similar to a “tornado watch” where all the factors point to a high likelihood of blue whale occurrence.
What it Doesn’t Mean: The blue whale model doesn’t specifically predict whether or how many whales are present in a grid cell, but it shows how suitable the habitat is for blue whales in each cell.
How It Works: This model uses data collected from 104 satellite-tagged blue whales to statistically relate whale presence to environmental conditions (e.g. salinity, chlorophyll-a, sea surface temperature, water column properties). Then, the model considers environmental conditions in near real-time for the Southern California Bight and San Francisco region from the previous day to estimate the probability of blue whale presence within each 10kmx10km grid cell.
More information about the way the model functions and was created is available:
Abrahms, Briana, Heather Welch, Stephanie Brodie, Michael G. Jacox, Elizabeth A. Becker, Steven J. Bograd, Ladd M. Irvine, Daniel M. Palacios, Bruce R. Mate, and Elliott L. Hazen. 2019. “Dynamic Ensemble Models to Predict Distributions and Anthropogenic Risk Exposure for Highly Mobile Species.” Diversity and Distributions 25 (8): 1182–93. https://doi.org/10.1111/ddi.12940.
NOAA Coastwatch WhaleWatch 2.0: https://coastwatch.pfeg.noaa.gov/projects/whalewatch2/whalewatch2_map.html.
Whale Presence Rating
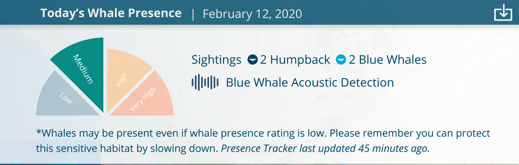
The Whale Presence Rating integrates whale sightings, acoustic whale detections, and blue whale predicted habitat suitability to provide a near real-time assessment of whale presence for each region. The goal of the Whale Presence Rating is to provide the shipping industry, natural resource managers, and the public with a straightforward data-driven assessment of whale presence to reduce the risk of ship collisions with endangered whales. For a more detailed view of whale data that drives the Whale Presence Rating, refer to the interactive map within the Whale Safe tool.
Whale Presence Rating: Acoustic Detections
Acoustic detection data for blue, humpback, and fin whales is transmitted from the moored buoy system in 15-minute summary periods. For each 15-minute period for which detection data were transmitted, a visual representation of classified, detected whale vocalizations is displayed in 1-minute panels. An analyst then reviews these data and indicates for each 15-minute period whether each of the monitored species was detected (Baumgartner et al. 2019).
For each day, we then calculate the percentage of 15-minute summary periods with confirmed acoustic detections of each species, as an indicator of vocalization persistence. Because some species are more vocal than others, there are species-specific thresholds that trigger different whale presence ratings.
| Species | Percentage of Summary Periods with Confirmed Acoustic Detections (Daily) | Whale Presence Rating |
| Blue, Humpback, or Fin | 0% | Low |
| Blue | >0% and <10% | Medium |
| Blue | ≥10% | High |
| Humpback | >0% and <15% | Medium |
| Humpback | ≥15% | High |
| Fin | >0% and <10% | Medium |
| Fin | ≥10% | High |
Whale Presence Rating: Visual Observations
Visual observation data collected by land and boat-based naturalists and NOAA aerial surveyors is summarized to determine the total number of blue, humpback, and/or fin whales detected each day. Visual observation data from 2013 – 2020 was used to calculate the average daily number of blue, humpback and/or fin whales that has historically been observed and recorded. The species-specific averages are used as thresholds to trigger different whale presence ratings. For each day that a trip occurs and either blue, humpback, or fin whales are observed, a medium Whale Presence Rating is triggered if the number of whale sightings recorded is at or below the average number sighted. If the number of whales sighted is above average, a high Whale Presence Rating is triggered.
| Species | Number of Whales Observed (Daily) | Whale Presence Rating |
| Blue, Humpback, or Fin | 0 | Low |
| Blue | 1 | Medium |
| Blue | >1 | High |
| Humpback | 1-6 | Medium |
| Humpback | >6 | High |
| Fin | 1 | Medium |
| Fin | >1 | High |
Whale Presence Rating: Blue Whale Habitat Model
The blue whale habitat model produces predictions of habitat suitability at a 10km resolution. For integration into the Whale Presence Rating, we calculate the average habitat suitability across the vessel speed reduction zone. We then compare this against a threshold value that was determined through additional analyses conducted by authors of Abrahms et al. 2019. In this analysis the distribution of observed blue whale sightings was compared to the average predicted habitat suitability values, and it was determined that peak densities of blue whale sightings occurred at average habitat suitability values above 0.75(SC) and 0.70(SF). Thus, a threshold of 0.75 and 0.70 is used in the Whale Presence Rating.
Southern California
| Species | Average Habitat Suitability Across Vessel Speed Reduction Zone | Whale Presence Rating |
| Blue | <0.75 | Low |
| Blue | ≥0.75 | Medium |
San Francisco
| Species | Average Habitat Suitability Across Vessel Speed Reduction Zone | Whale Presence Rating |
| Blue | <0.70 | Low |
| Blue | ≥0.70 | Medium |
High suitability predictions are very similar to a “tornado watch” where all the factors point to a high likelihood of blue whale occurrence. However because the model is not able to definitively confirm if blue whales are present, the model cannot trigger a high Whale Presence Rating on its own.
Whale Presence Rating: Integration of Acoustic, Visual, and Model Data
When integrated into the Whale Presence Rating, each datastream has a 5-day lookback period to reduce the impact of sampling bias and missed detections. When we consider all species and detection modalities together, the maximum calculated Whale Presence Rating drives the overall Whale Presence Rating. As an example, if on a single day humpback whales were detected acoustically 10% of the time (medium rating), 2 humpback whales are observed (medium rating), the blue whale model average was 0.4 (low rating), and 2 fin whales were observed (high rating), that would result in a high whale presence rating due to the 2 fin whale sightings. If two or more whale species have a high Whale Presence Rating, the integrated Whale Presence Rating is increased to ‘very high.’
Whale Presence Rating: Certainty Assessment
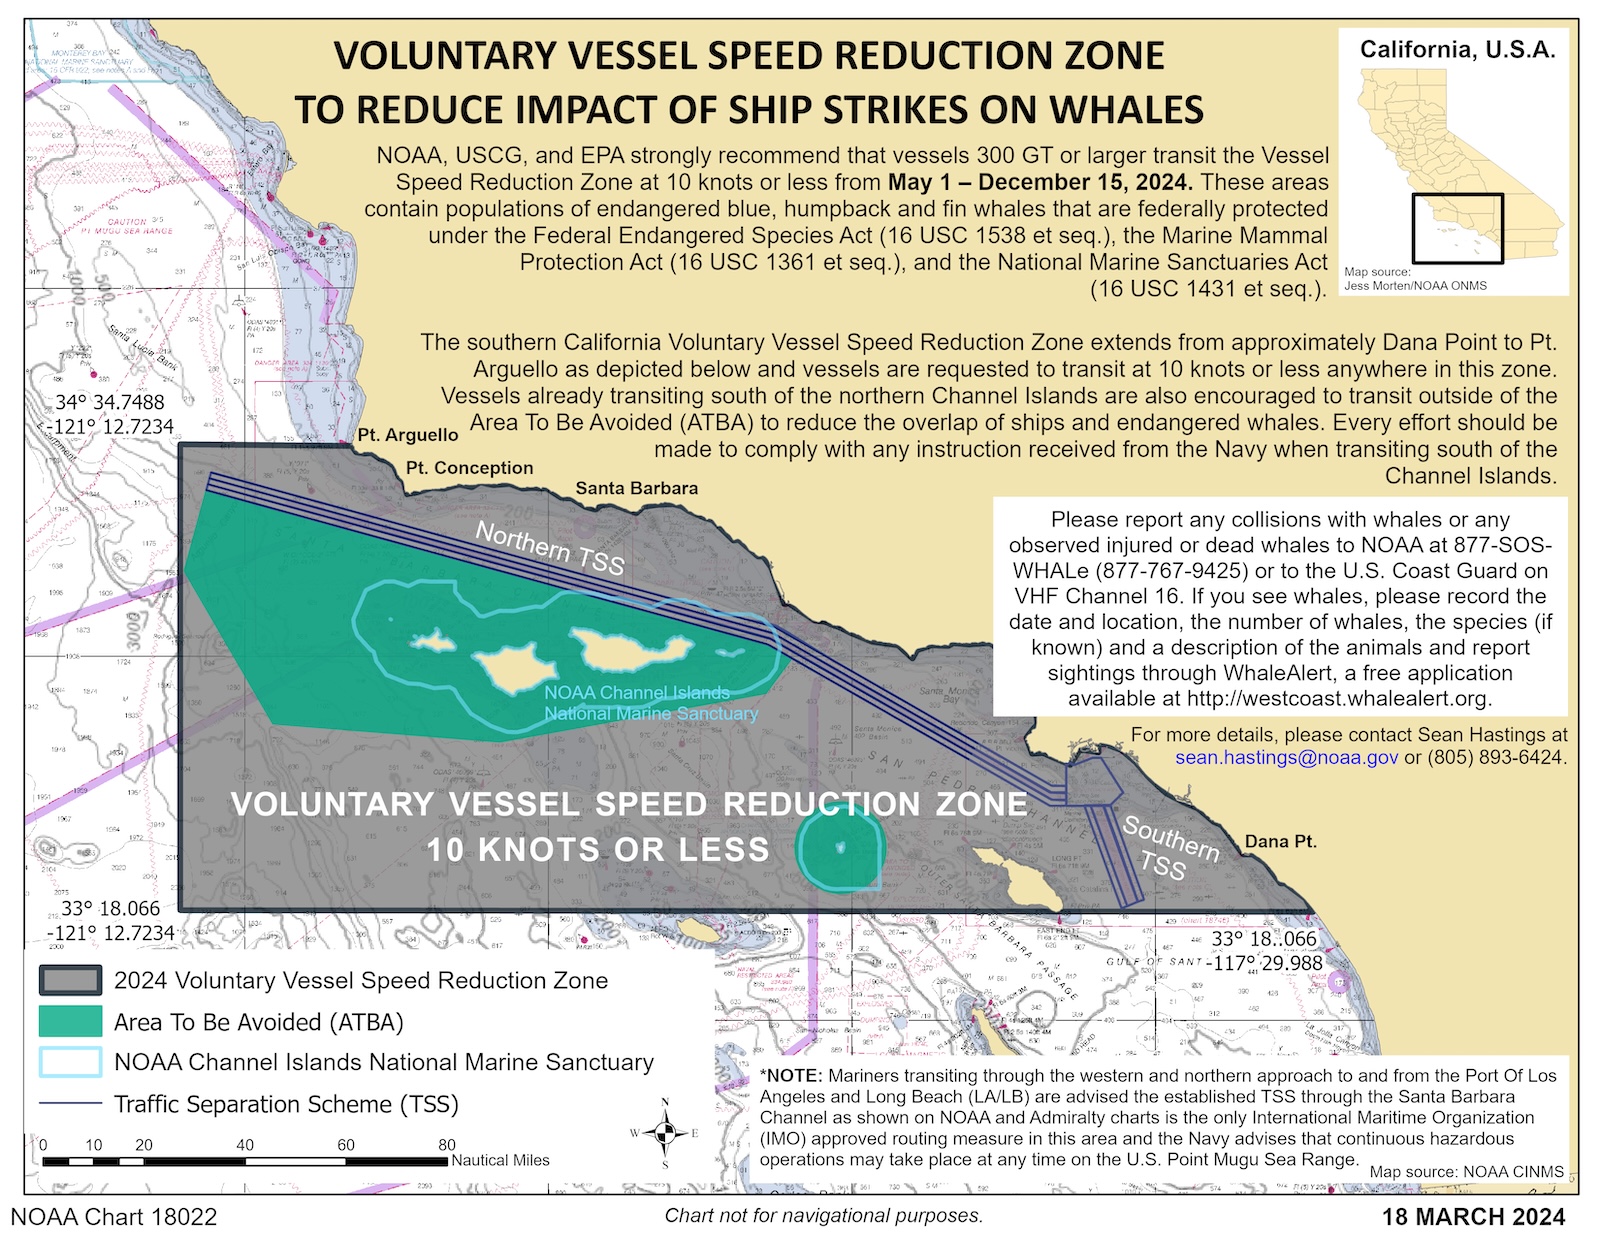
The Automatic Identification System (AIS) is a GPS-like tracking system that large ships use to navigate and avoid collisions. The International Maritime Organization and many national governments require that large vessels use AIS and broadcast their identity, location, speed, and other characteristics. Ground stations and satellites then pick up AIS information, meaning that ships can be tracked throughout the global ocean. AIS data was provided by Spire and processed by Global Fishing Watch to produce vessel tracklines for all AIS-transmitting ships within NOAA’s voluntary vessel speed reduction zone in the Santa Barbara Channel and San Francisco regions. NOAA’s voluntary vessel speed reduction zone applies to all vessels ≧ 300 gross registered tons transiting within a defined area during a specific date range (usually May 1 – December 15). A notice of the vessel speed reduction zone is distributed via the US Coast Guard’s Local Notice to Mariners (District 11).
For each vessel ≧ 300 gross registered tons that traversed the active vessel speed reduction zone, we calculate the total distance that each vessel traveled in the zone by measuring the distance between consecutive AIS data points. We then use the AIS device’s reported speed over ground to calculate the percentage of that distance that was traveled at or below a speed of 10 knots (18.5 km/h, 11.5 mph), in order to determine the vessel’s cooperation rate with NOAA’s voluntary 10 knot speed recommendation. The cooperation rate is calculated as the percentage of the total distance traveled at or below 10 knots. Any nautical miles traveled in the area to be avoided (ATBA) in southern California are classified as penalty miles and get counted against nautical miles traveled at or below 10 knots. Vessels are assigned to operators using data from IHS Markit and cross referenced with Marine Exchange of Southern California data for the Santa Barbara Channel. This is the best available data; however, vessel lists may differ from other sources, and operators are encouraged to contact bosl-whalesafe@ucsb.edu with any suggested modifications to their vessel list. Cooperation rates are displayed for all operators that have at least 100 nautical miles of transit distance in the vessel speed reduction zone. AIS analysis is only provided for the Southern California and San Francisco vessel speed reduction zone at this time.
| Grade | Cooperation Rate |
| A+ | 99 – 100 % |
| A | 80 – 98.9% |
| B | 60 – 79.9% |
| C | 40 – 59.9% |
| D | 20 – 39.9% |
| F | 0 – 19.9% |
The information and data provided by Whale Safe is intended for informational purposes only and must be relied upon solely at your own risk. Using the data sources mentioned above, every effort has been made to accurately prepare ship speed calculations and cooperation scores that reflect the most current available data at the time of their calculation. AIS data may be subject to inaccuracies, incompleteness, or error; therefore, Whale Safe cannot guarantee the accuracy of the information, or provide warranties of any kind. Please contact us with any questions or concerns at: bosl-whalesafe@ucsb.edu
Assessing Whale Presence – San Francisco Bay
The San Francisco Bay system differs from the other systems used along the California coast. The Bay is a confined waterway with heavy commercial vessel traffic and a high concentration of gray whale who in recent years have begun entering the Bay to rest and attempt to feed during their long migration. In this environment, knowing the specific location of individual whales is critical to preventing ship strikes. To meet that need, the San Francisco Bay node uses two near real-time data sources: thermal camera detections and trained human observations. Together, these provide ship captains and pilots transiting the Bay with timely, location-specific alerts when whales are detected in or near busy shipping areas.
Infrared Thermal Camera Data
What It Means: A thermal camera detection indicates that a whale has surfaced within the camera’s field of view. Because thermal cameras detect heat signatures from a whale’s exhalation (blow) and exposed body at the surface, a detection provides a confirmed sighting along with a specific location and time.
What It Doesn’t Mean: Thermal cameras only detect whales when they surface within the camera’s field of view. A whale that is submerged, outside the monitored area, or obscured by environmental conditions may not be detected. A lack of detections does not mean no whales are present.
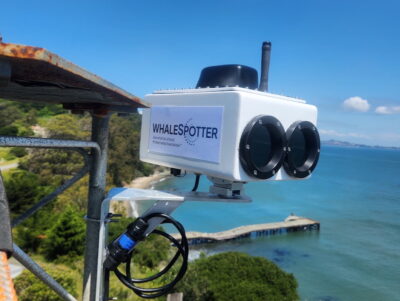
How It Works: The system uses thermal cameras paired with AI-powered detection technology developed by WhaleSpotter to identify marine mammals 24 hours a day by detecting the heat signature of a warm-blooded whale’s blow at a range of up to 4 nautical miles.
Visual Observation Data

What It Means: Direct whale sightings by trained naturalists that are land-based and aboard vessels can confirm there are whales present. When whales are sighted, observers photograph the whale and record date, time location, the number sighted, and species (if known).
What It Doesn’t Mean: Surveys aren’t constant and aren’t guaranteed to cross paths of all the whales in the regions, so a lack of sightings does not necessarily indicate that there are no whales present
How It Works: Scientists from The Marine Mammal Center conduct boat-based surveys and land-based observations within San Francisco Bay, recording whale sightings as they occur. These direct observations complement the thermal camera system by extending coverage to areas and times beyond the camera’s field of view, and by providing expert species identification. When whales are spotted, their location, species, and behavior are recorded with the Whale Alert and Spotter Pro mobile apps.
Whale Presence Rating
The Whale Presence Rating integrates whale sightings and infrared thermal camera whale detections to provide a near real-time assessment of whale presence for San Francisco Bay. The goal of the Whale Presence Rating is to provide mariners with a straightforward data-driven assessment of whale presence to reduce the risk of ship collisions with gray and humpback whales.
Monitoring Ship Traffic
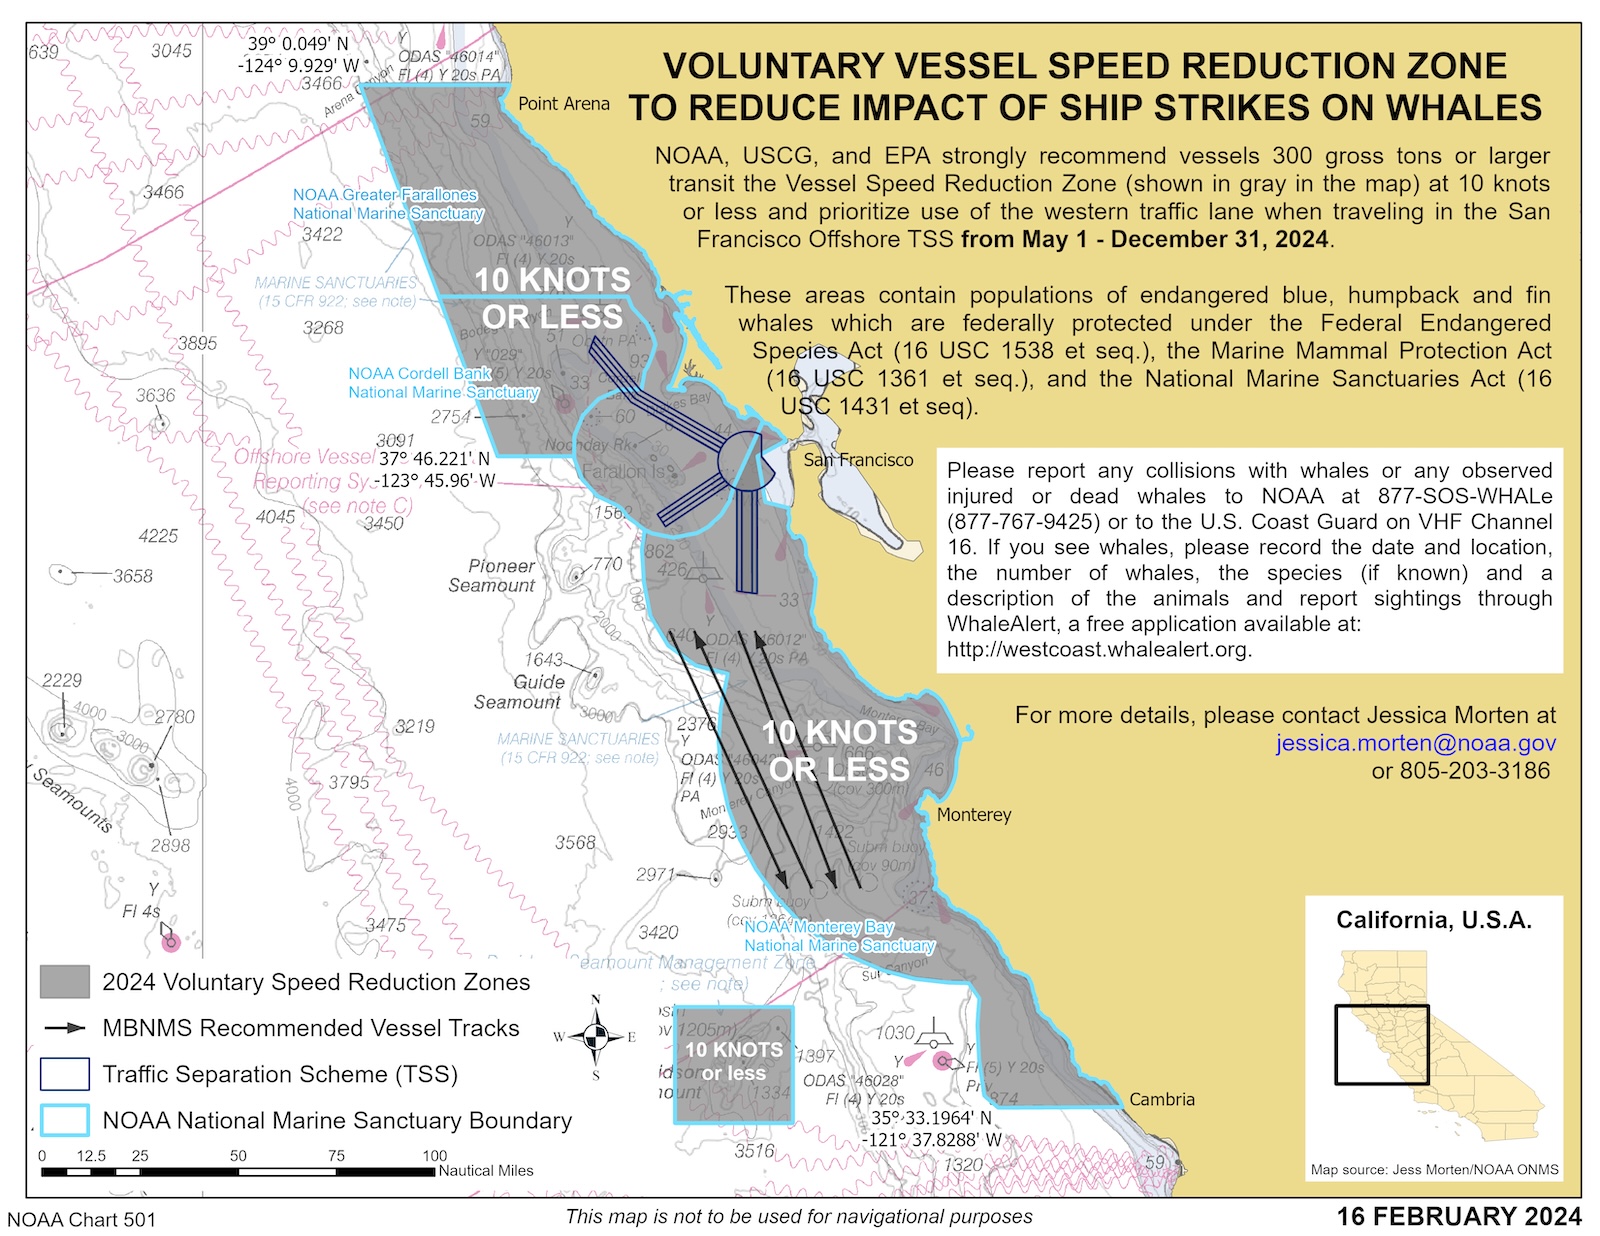
The Automatic Identification System (AIS) is a GPS-like tracking system that large ships use to navigate and avoid collisions. The International Maritime Organization and many national governments require that large vessels use AIS and broadcast their identity, location, speed, and other characteristics. Ground stations and satellites then pick up AIS information, meaning that ships can be tracked throughout the global ocean. AIS data was provided by Kpler and processed by Global Fishing Watch to produce vessel tracklines for all AIS-transmitting ships within California’s voluntary vessel speed reduction zones. The voluntary vessel speed reduction zone applies to all vessels ≧ 300 gross registered tons transiting within a defined area during a specific date range (usually May 1 – December 31).
For each vessel ≧ 300 gross registered tons that traversed the active vessel speed reduction zone, we calculate the total distance that each vessel traveled in the zone by measuring the distance between consecutive AIS data points. We then use the AIS device’s reported speed over ground to calculate the percentage of that distance that was traveled at or below a speed of 10 knots (18.5 km/h, 11.5 mph), in order to determine the vessel’s cooperation rate with the voluntary 10 knot speed recommendation. The cooperation rate is calculated as the percentage of the total distance traveled at or below 10 knots. Any nautical miles traveled in the area to be avoided (ATBA) in southern California are classified as penalty miles and get counted against nautical miles traveled at or below 10 knots. Vessels are assigned to operators using data from IHS Markit and cross referenced with Marine Exchange of Southern California data for the Santa Barbara Channel. This is the best available data; however, vessel lists may differ from other sources, and operators are encouraged to contact bosl-whalesafe@ucsb.edu with any suggested modifications to their vessel list. Cooperation rates are displayed for all operators that have at least 100 nautical miles of transit distance in the vessel speed reduction zone.
| Grade | Cooperation Rate |
| A+ | 99 – 100 % |
| A | 80 – 98.9% |
| B | 60 – 79.9% |
| C | 40 – 59.9% |
| D | 20 – 39.9% |
| F | 0 – 19.9% |
The information and data provided by Whale Safe is intended for informational purposes only and must be relied upon solely at your own risk. Using the data sources mentioned above, every effort has been made to accurately prepare ship speed calculations and cooperation scores that reflect the most current available data at the time of their calculation. AIS data may be subject to inaccuracies, incompleteness, or error; therefore, Whale Safe cannot guarantee the accuracy of the information, or provide warranties of any kind. Please contact us with any questions or concerns at: bosl-whalesafe@ucsb.edu