2022 Year in Review: A Look Back at Whales & Ships in the Santa Barbara Channel & San Francisco Region
This Year At A Glance
It was an exciting year for the Whale Safe team and our partners. We launched a second Whale Safe system in San Francisco, another region with a high overlap of whales and ships. With this expansion of the Whale Safe system, we are able to provide near real-time whale and ship data to mariners and resource managers in both Southern California and the San Francisco region to reduce the risk of fatal ship collisions with endangered whales along the California coast.
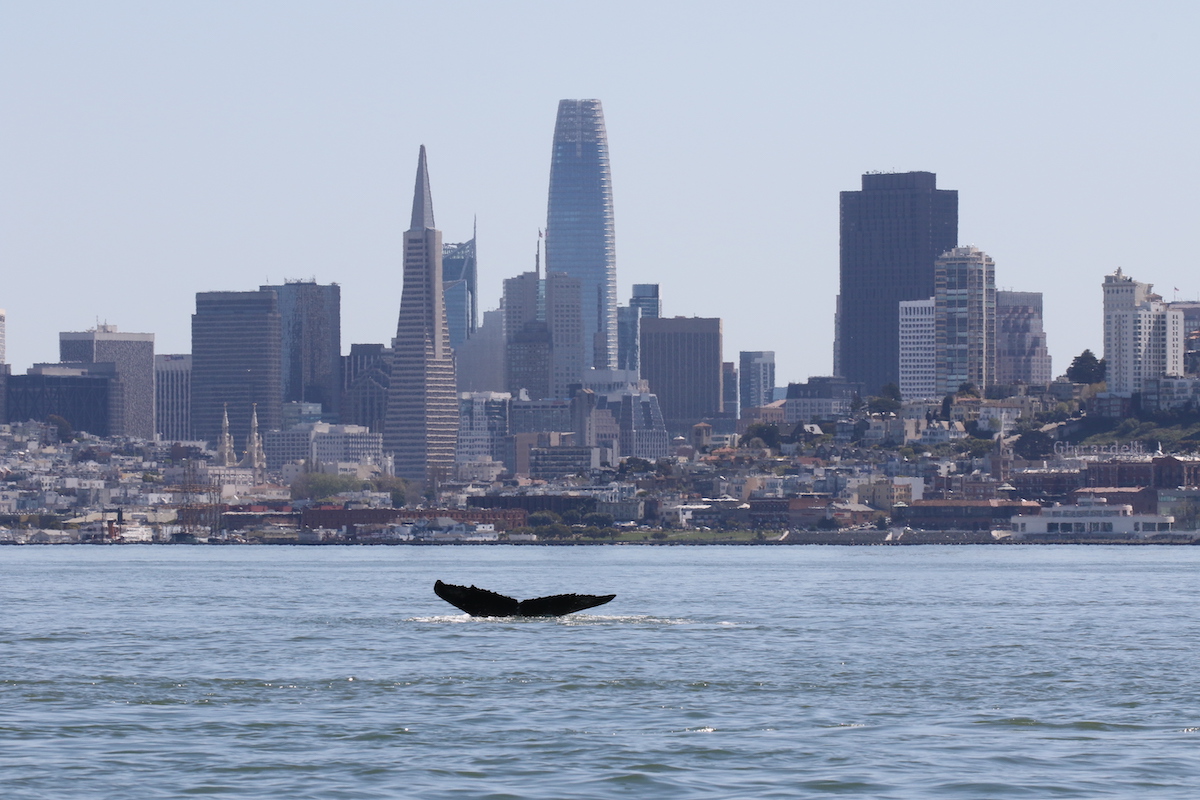
Fluke of a humpback whale in the San Francisco Bay. Photo by: Bekah Lane, The Marine Mammal Center
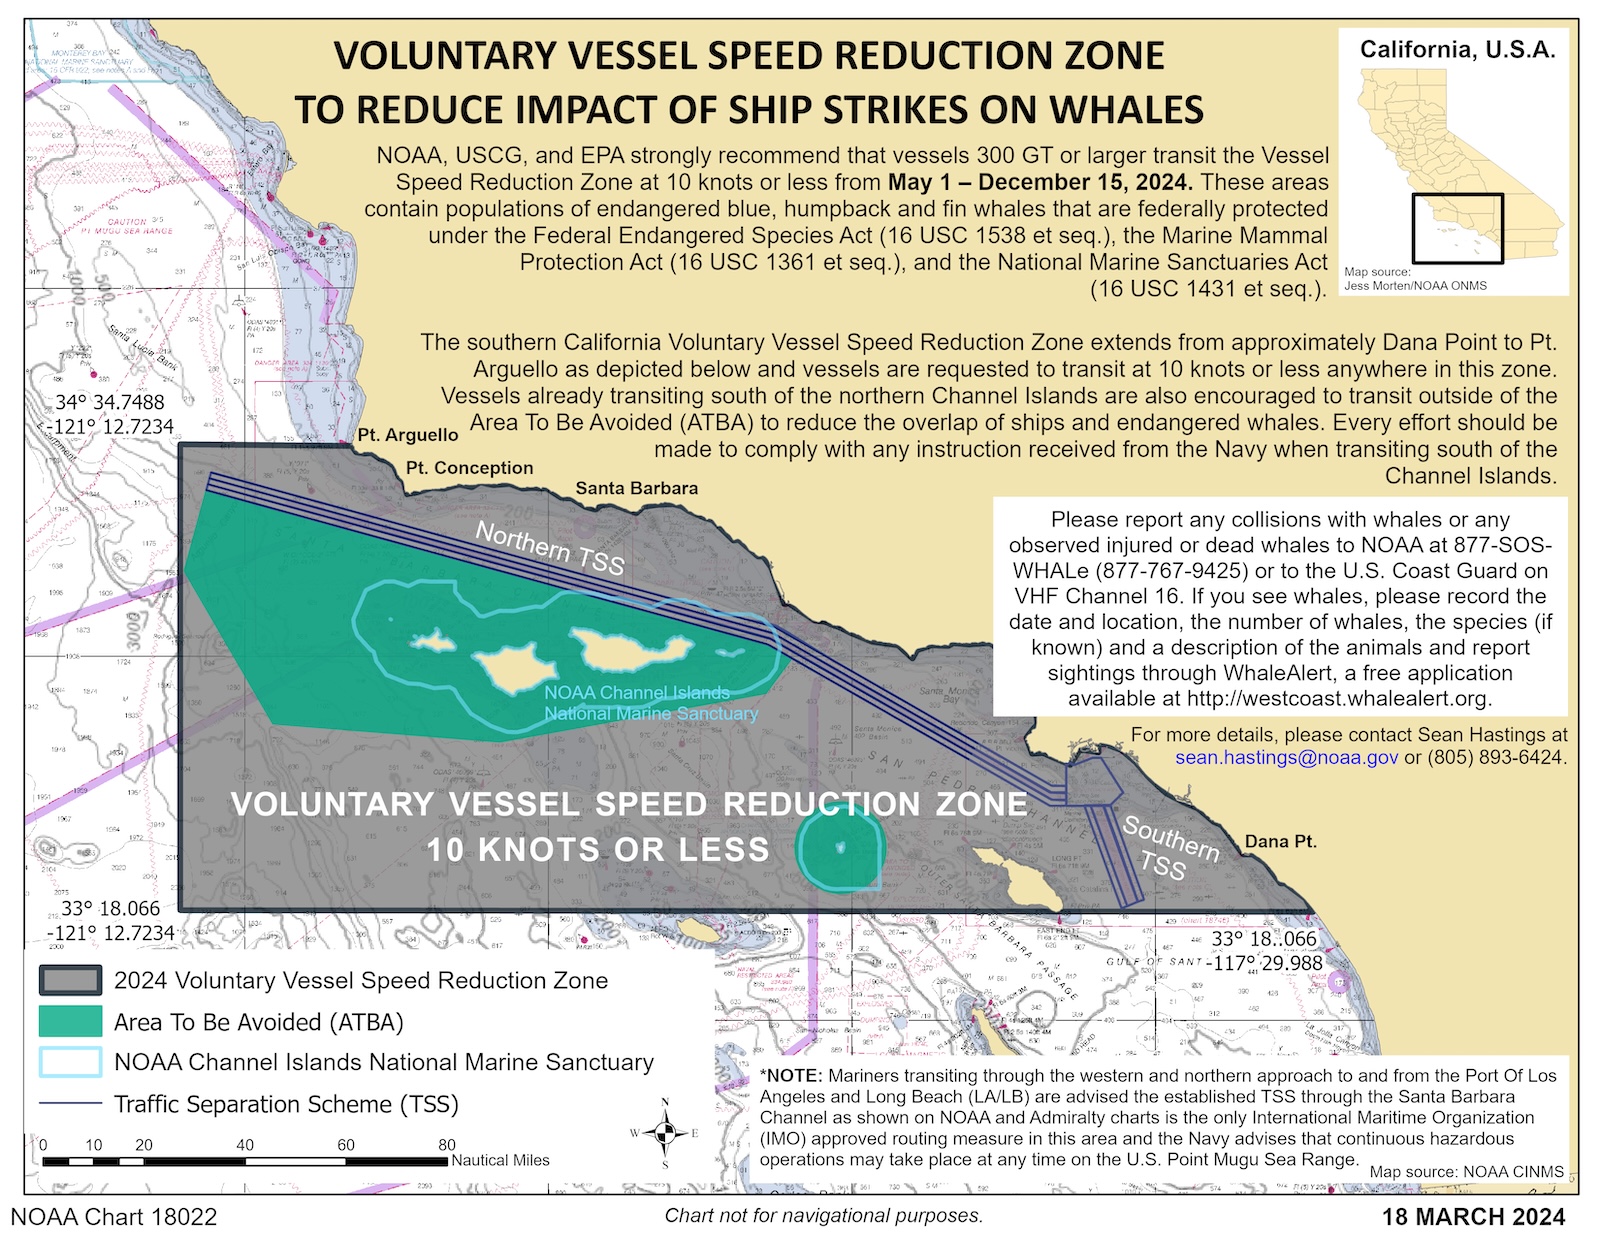
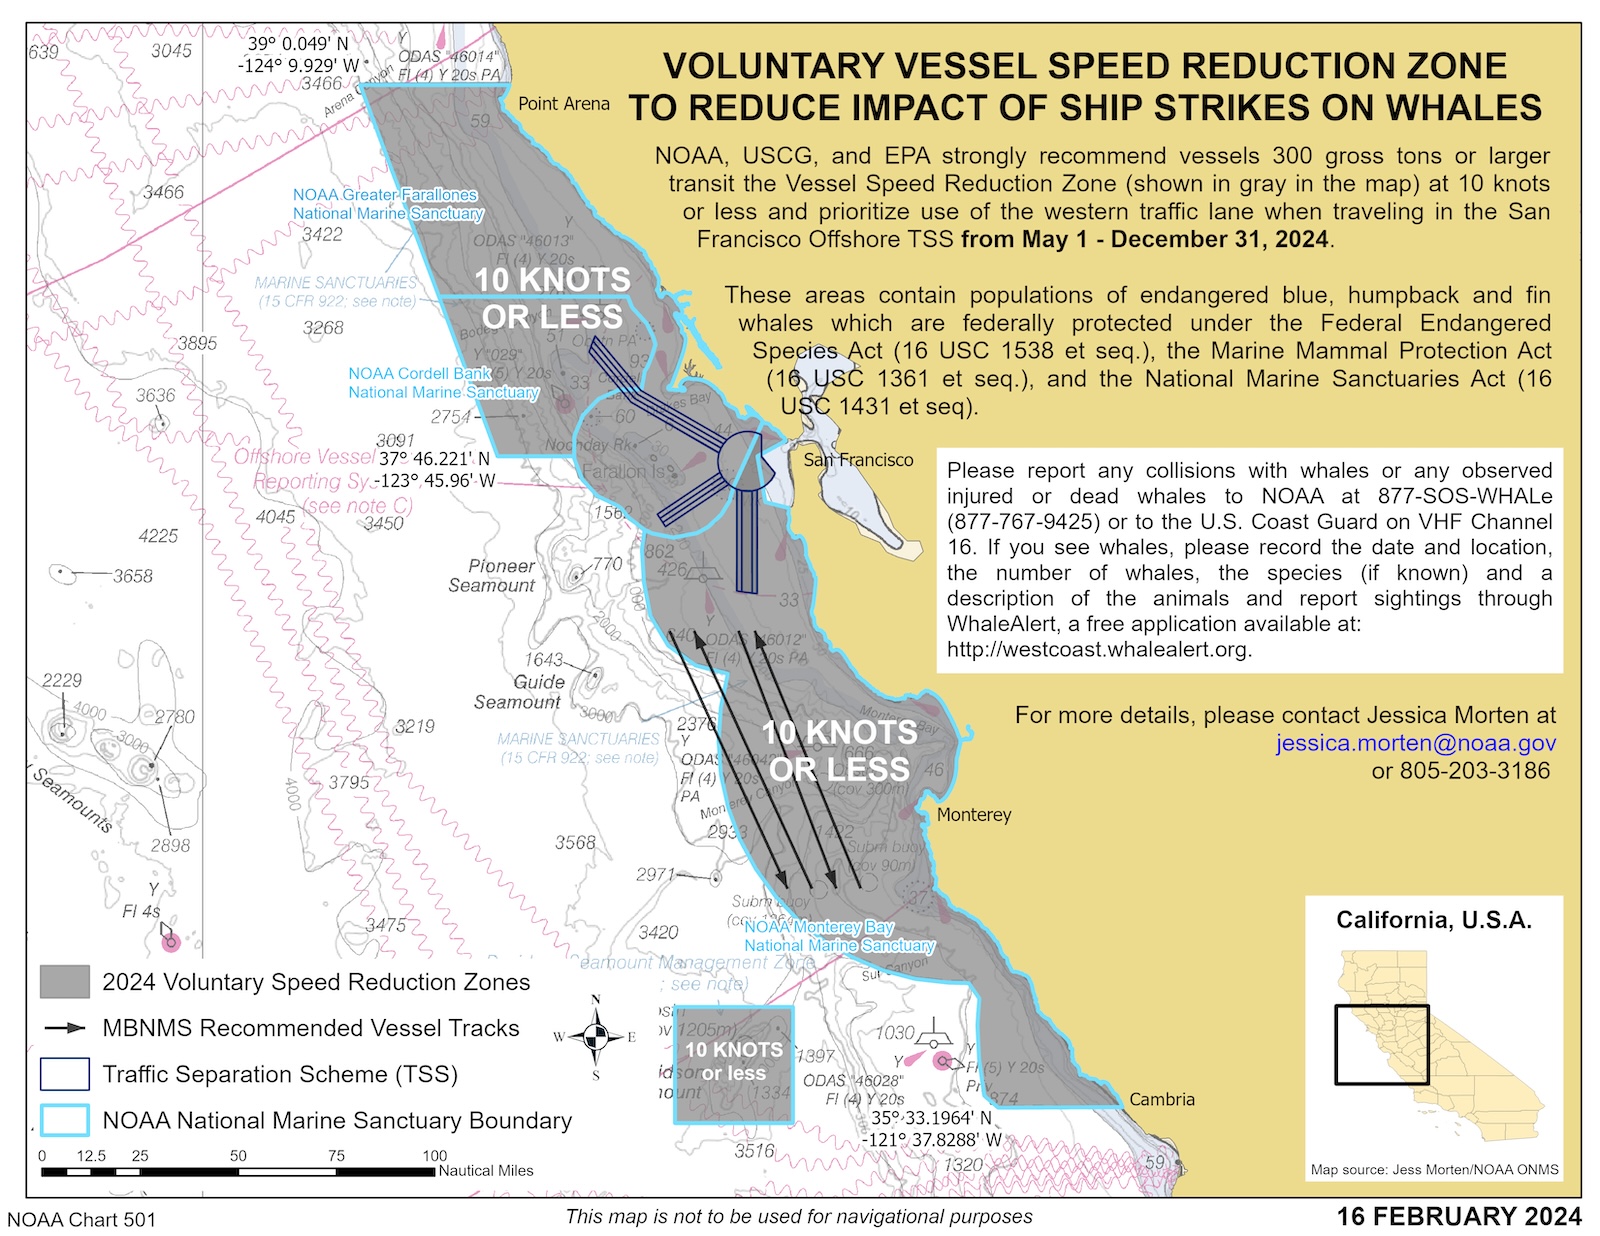
As the 2022 season came to a close, we looked back at whale and ship data in the federally designated vessel speed reduction (VSR) zones in both of these regions. In these areas, NOAA, US Coast Guard, and the EPA ask vessels larger than 300 gross tons to slow down to 10 knots or less during the peak foraging months for endangered whales from May 1 through December 15.
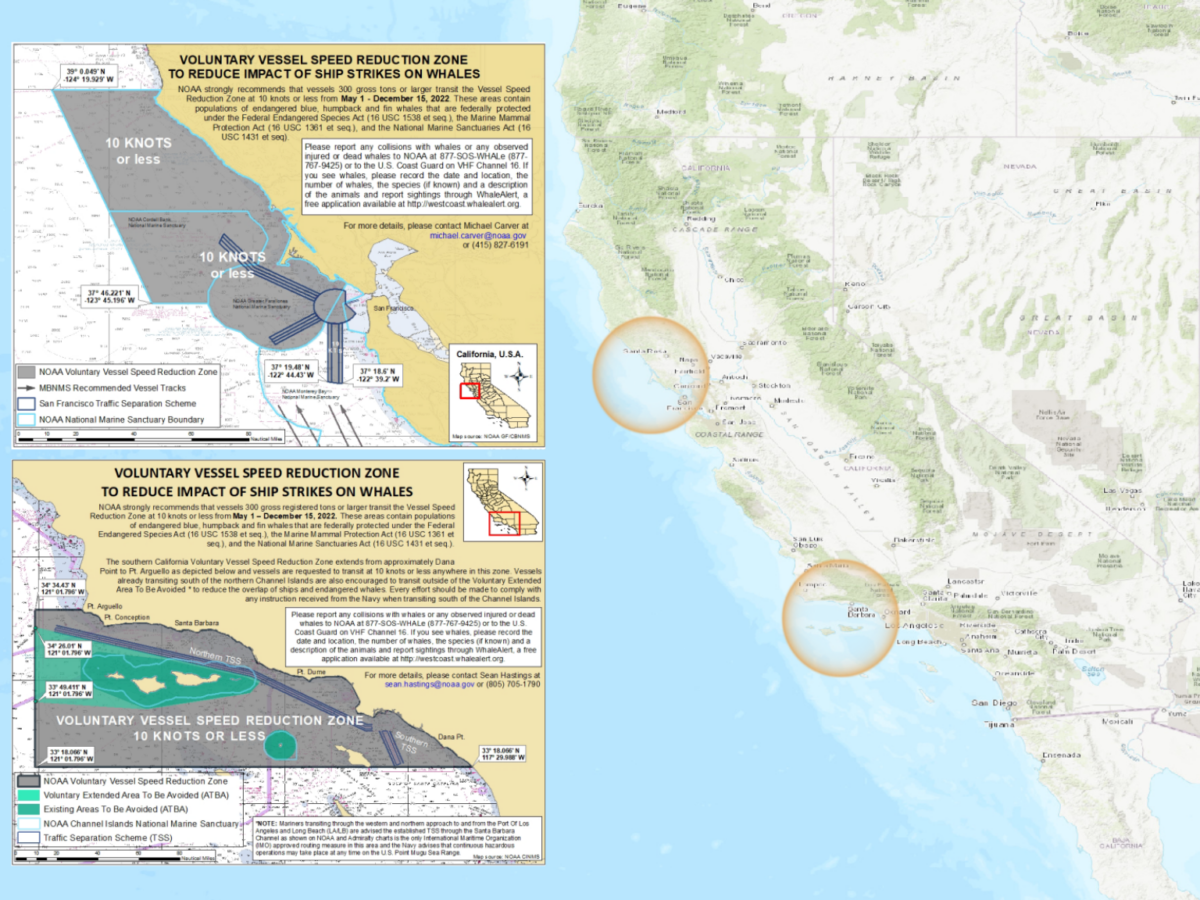
NOAA, US Coast Guard, and the EPA implemented a 10-knot voluntary speed limit for large ships transiting these two regions from May 1 – December 15, 2022. This notice is sent to vessels via the Coast Guard Local Notice to Mariners.
Below is a recap of whale and ship data collected by our Whale Safe systems in Southern California and San Francisco throughout this VSR season. We used visual and acoustic detections to show when blue, humpback, and/or fin whales were present and current oceanographic conditions to determine where blue whales were likely to be. Every day, this information was integrated into a whale presence rating (low, medium, high, very high) for each region. Whale Safe also provided a reporting system that summarized AIS data to determine which vessels and companies best abided by voluntary speed recommendations throughout the season.
Southern California Overview
The Santa Barbara Channel is an important stop for many whales during their annual migration to feed along the West Coast. It was an active season with 807 sightings of blue and humpback whales over 110 days between May 1 and December 15. The whale presence rating was “high” or “very high” for 83% of that time.
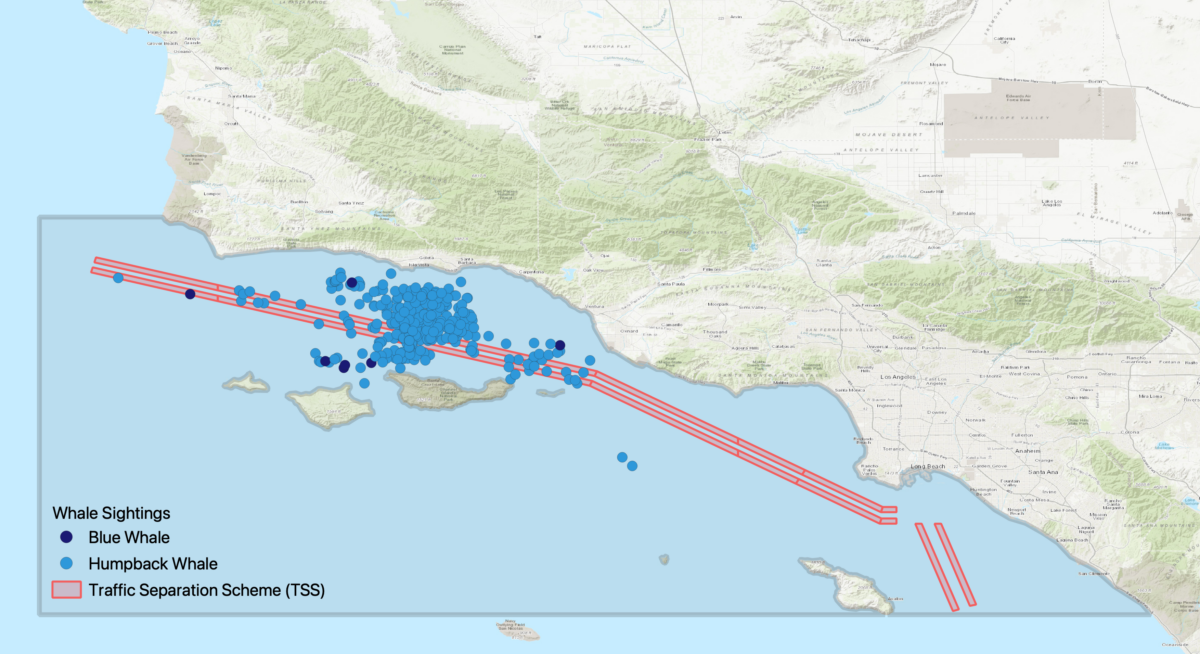
There were 807 sightings of blue and humpback whales recorded by trusted users on Spotter Pro and Whale alert apps between May 1-December 15, 2022.
Acoustic detection data for blue, humpback, and fin whales transmitted from the moored buoy system in 15-minute summary periods from May 1 – December 15, 2022. The Daily Call Rate is the percentage of 15-minute summary periods with confirmed acoustic detections of each species each day.
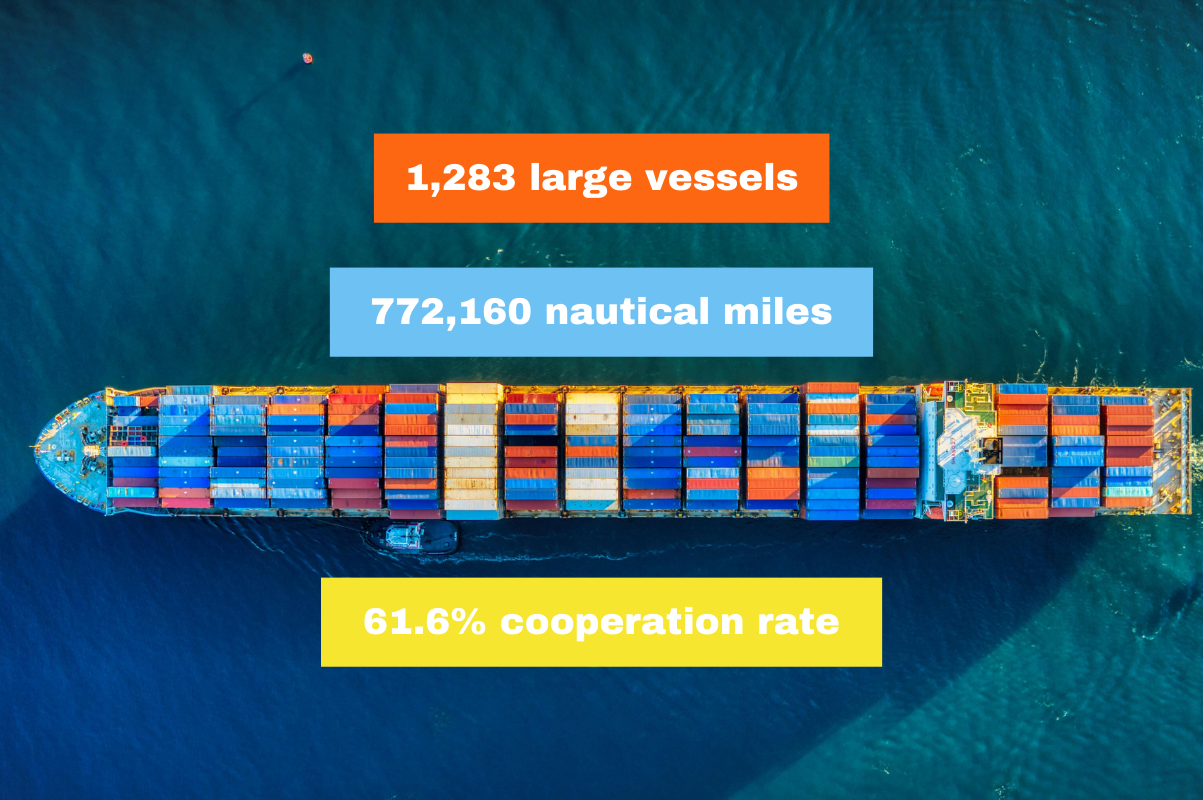
Overall, there were 1,283 large vessels (>300 tons) that transited a total of 772,160 nautical miles with an overall cooperation rate of 61.6%. This is a 10% increase in the number of ships transiting through this area and an 8% increase in the overall number of nautical miles traveled within this zone as compared to the previous year. Despite the overall increase in vessel activity, the cooperation rate of operators improved again this year from 58.8% to 61.6%.
San Francisco Overview
The San Francisco system launched in September and within the first three months of data collection there were already high numbers of whale sightings and acoustic detections. There were 544 sightings of blue, humpback, and fin whales in only 50 days. The whale presence rating was high or very high for 100% of the days between its launch in mid-September through December 15.
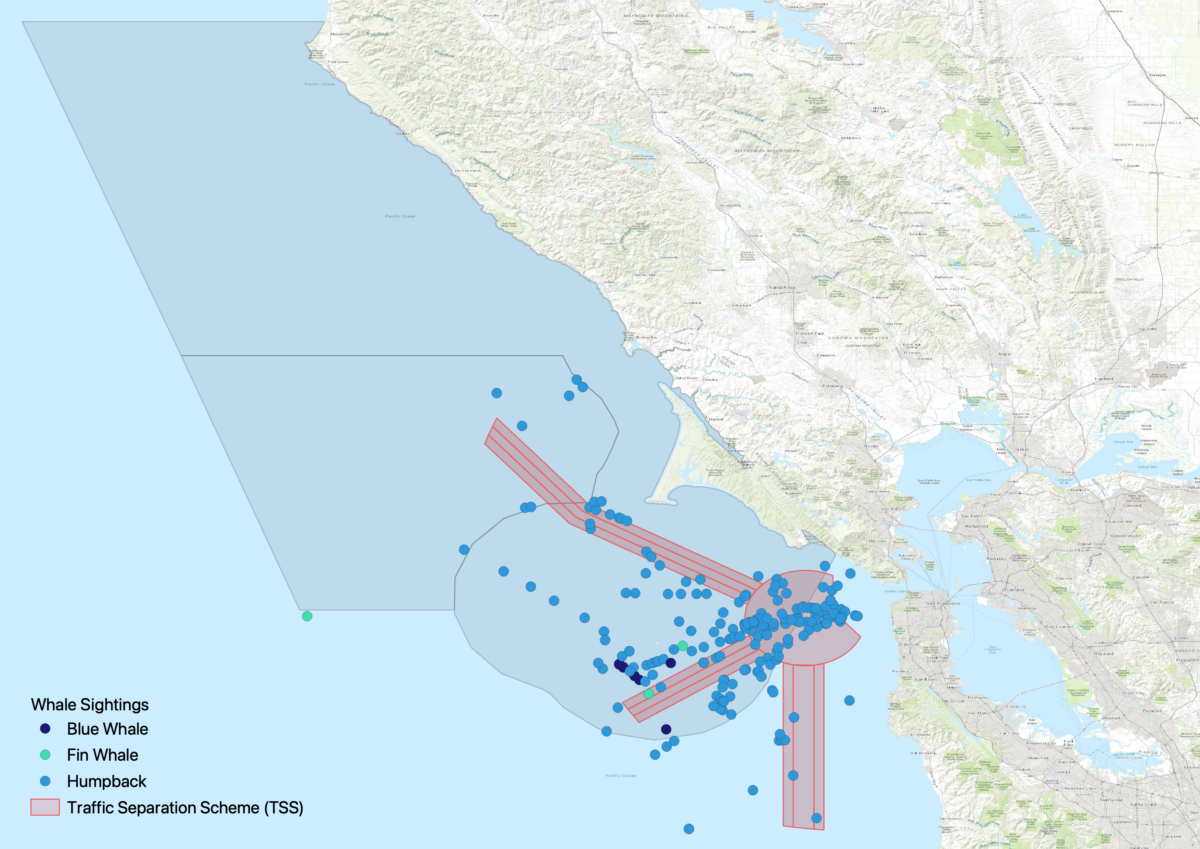
There were 544 sightings of blue, fin, and humpback whales recorded by trusted users and citizen scientists who assisted in collecting data on Spotter Pro and Whale alert apps from September 15-December 15, 2022.
Acoustic detection data for blue, humpback, and fin whales transmitted from the moored buoy system in 15-minute summary periods from September 15-December 15, 2022. The Daily Call Rate is the percentage of 15-minute summary periods with confirmed acoustic detections of each species each day.
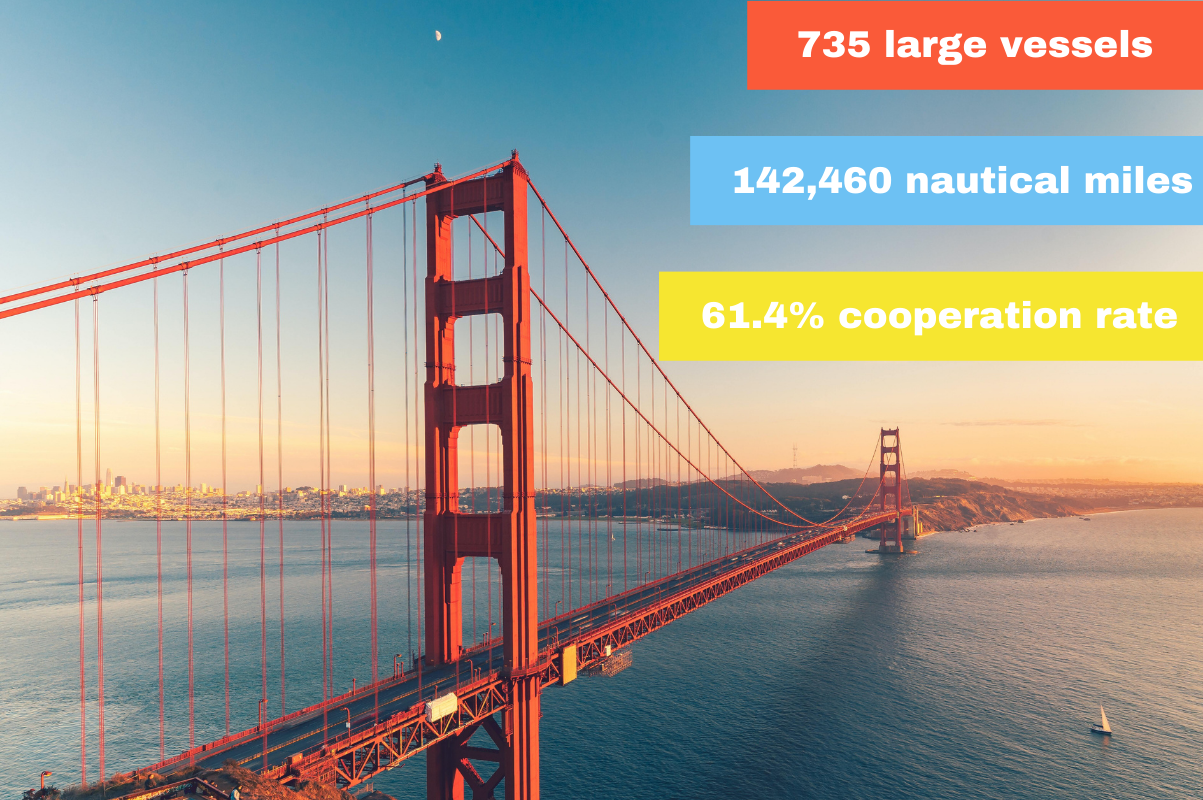
Overall, there were 735 large vessels (>300 tons) that transited a total of 142,460 nautical miles and a 61.4% cooperation rate from May 1 through December 15, 2022.
Aggregated Ship Analytics
With the launch of the San Francisco system, we can now provide aggregated report cards that provide combined analytics for companies that transit the vessel speed reduction zones in both Southern California and San Francisco. Below are the top 10 companies by fleet distance in 2022 for both regions:
Top 10 Shipping Companies by Fleet Transit Distance for 2022
| Operator | Total Nautical Miles | Grade 2022 |
|---|---|---|
| Ocean Network Express Pte Ltd | 34,350 | B (79.3%) |
| Maersk A/S | 31,909 | A (81.3%) |
| Matson Navigation Co Inc | 30,816 | F (17.5%) |
| Evergreen Marine Corp | 26,179 | B (74.6%) |
| Chevron Shipping Co LLC | 24,481 | B (73.5%) |
| COSCO Shipping Lines Co Ltd | 22,039 | A (86.3%) |
| CMA CGM SA The French Line | 20,147 | B (79.4%) |
| NYK Line | 19,457 | A (83.6%) |
| Kawasaki Kisen Kaisha Ltd | 16,082 | B (73.8%) |
| MSC Mediterranean Shipping Co | 15,240 | A (92.1%) |
Currently, you can sign up for daily or weekly whale data updates or monthly shipping data updates on the get involved page on the Whale Safe website, or you can access the daily whale data via our Twitter feed, @whalesafe_sc & @whalesafe_sf (coming soon), or through an Application Programming Interface (API). Email us at bosl-whalesafe@ucsb.edu to find out more. Stay tuned for more exciting updates this upcoming year!