2023 Year in Review: A Look Back at Whales & Ships in the Santa Barbara Channel & San Francisco Region
This Year At A Glance
2023 has been another exciting year for whales along the California coast! We have seen more whale sightings than the previous year, with almost 3,000 blue, humpback, and fin whale sightings* reported across the Southern California and San Francisco regions between May and December. This season also witnessed the appearance of killer whales, with a series of sightings reported in Southern California during December. *Note: an individual whale could be sighted multiple times.
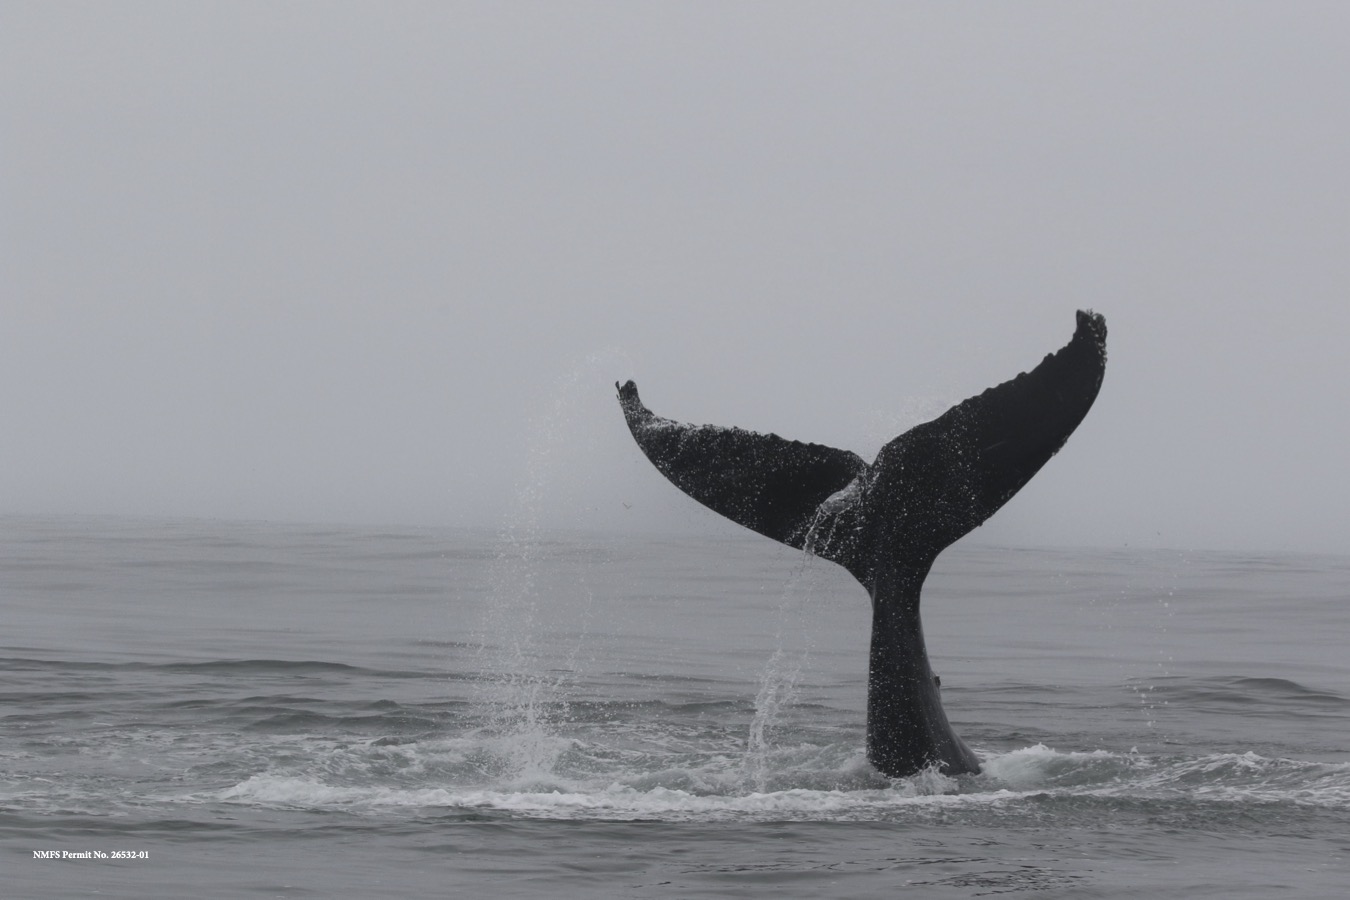 Fluke of a humpback whale in the San Francisco Bay. Photo by: Pilar Rodriguez, The Marine Mammal Center, photos were taken under NMFS Permit No. 26532-01
In addition to all those exciting encounters with whales out on the water, there was some good news for whales this season:
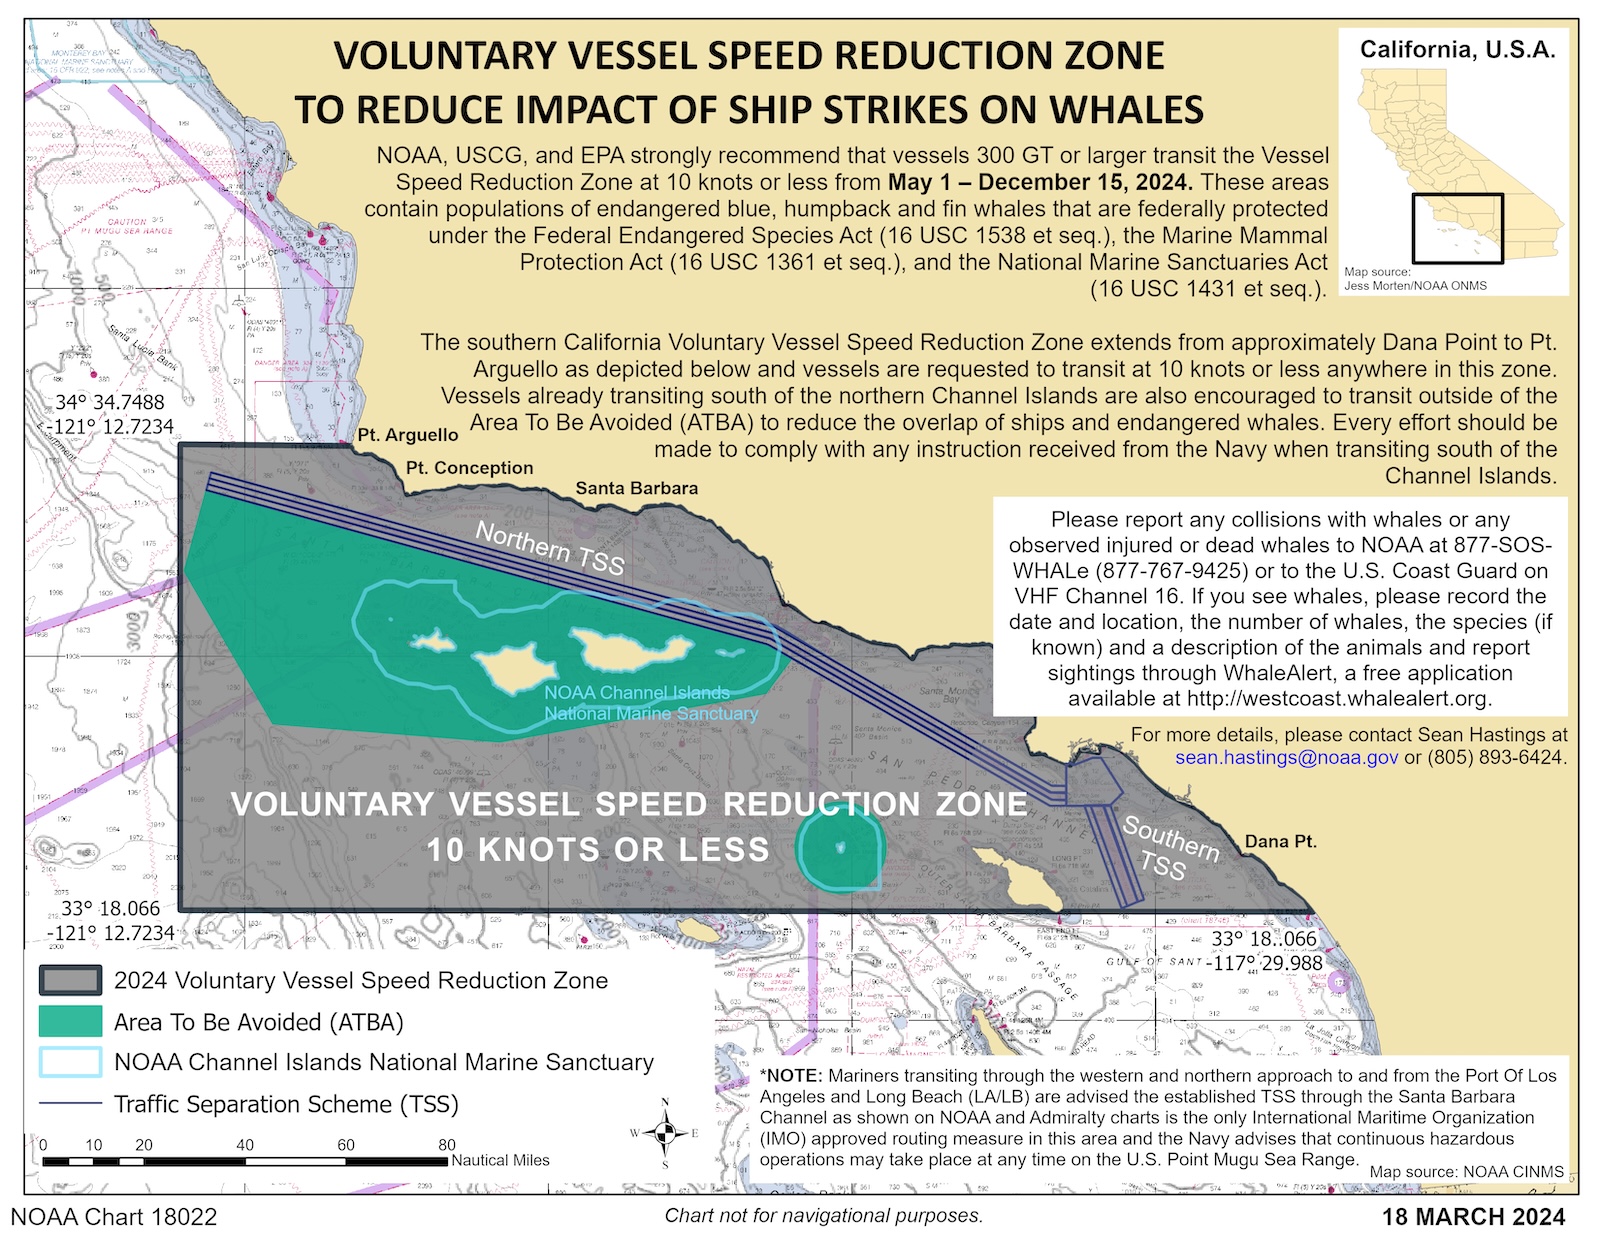
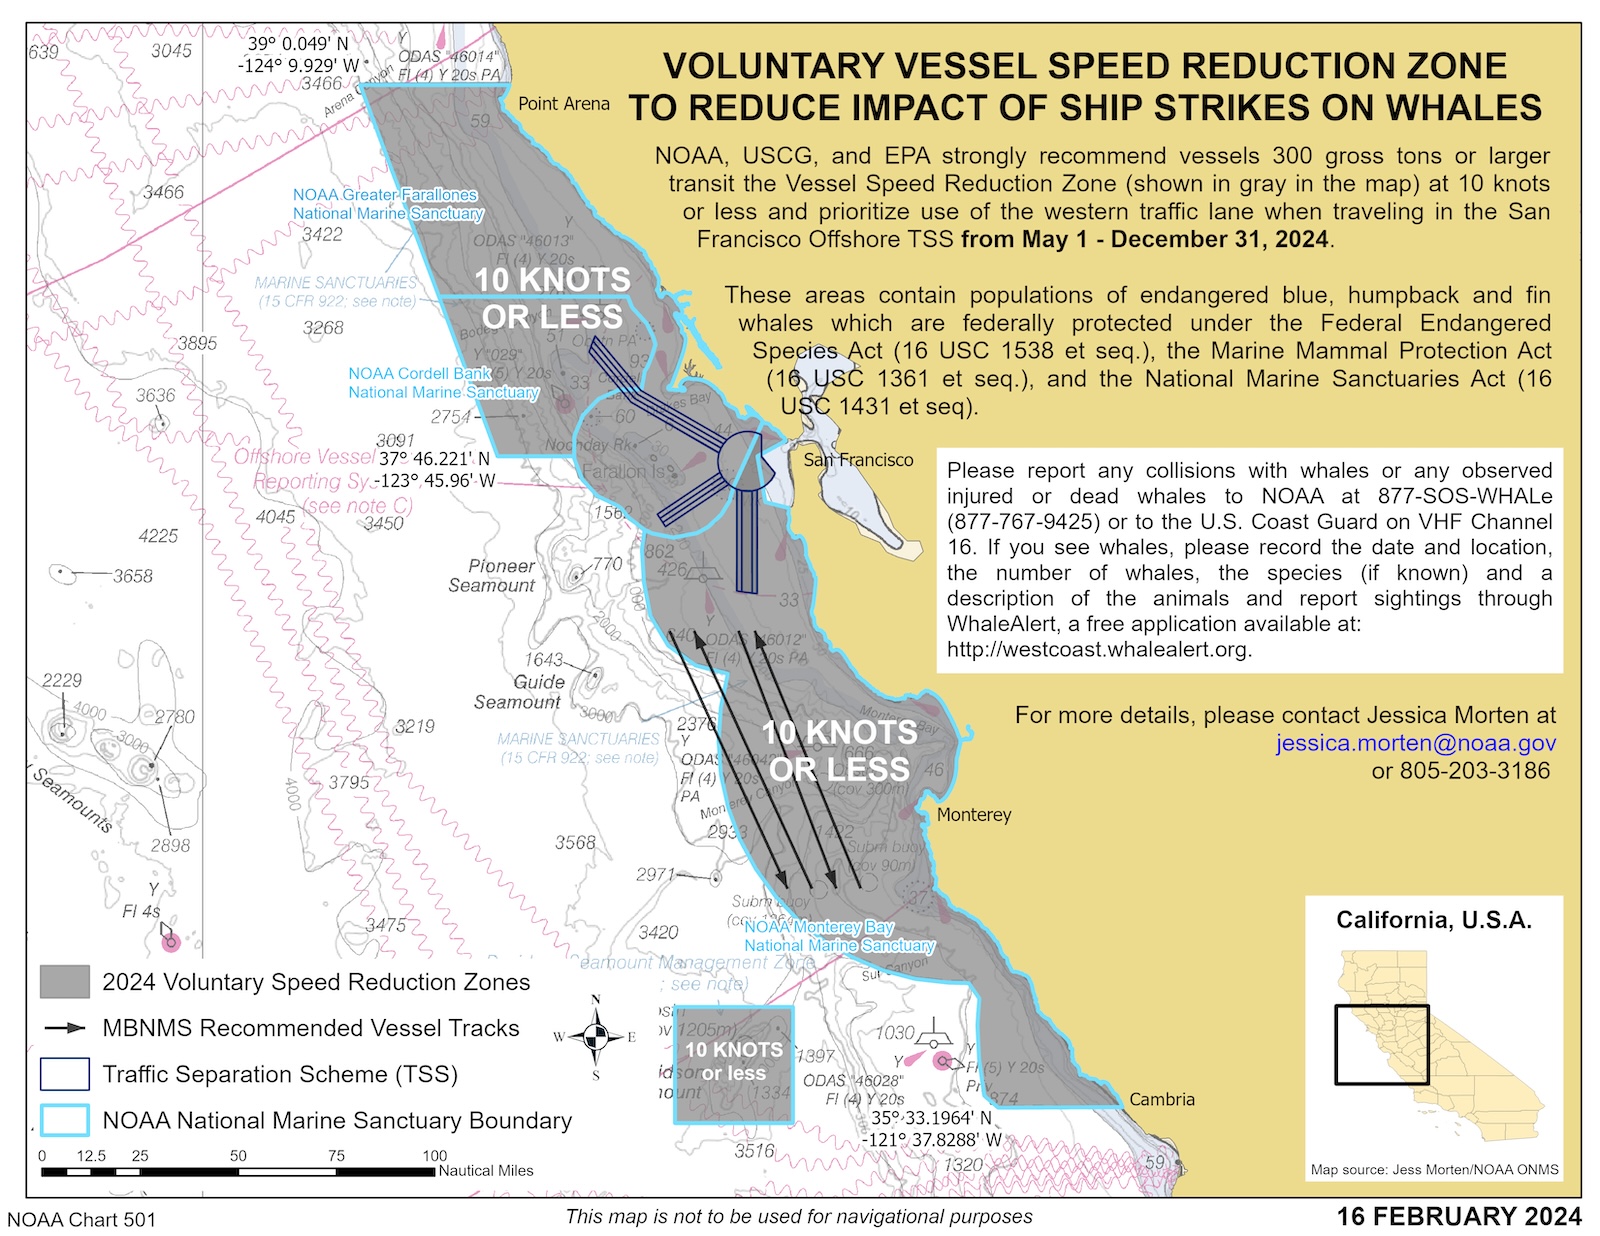
This past May, the San Francisco region Vessel Speed Reduction (VSR) zone expanded to include Monterey Bay National Marine Sanctuary and the Southern California VSR zone was expanded to include recent International Maritime Organization modifications to the Santa Barbara Channel Traffic Separation Scheme (TSS) and Area To Be Avoided (ATBA) (NOAA). In these VSR zones, NOAA, US Coast Guard, and the EPA ask large vessels to slow down to 10 knots May 1 through December 15, the peak months we have endangered whales in these waters.
-
2023 NOAA/USCG/EPA voluntary Vessel Speed Reduction Zone for the San Francisco and Monterey Bay regions. Reducing speed to 10 knots or less reduces air emissions, the risk of a fatal ship strike on whales, and ocean noise. Credit: NOAA
In October, the Santa Barbara Channel was designated as a Whale Heritage Area–highlighting the importance of this area for whales and the region’s commitment to promoting responsible ecotourism, providing ocean educational opportunities, and supporting on-going research and conservation efforts like the work that we and our partners do to protect whales in the area. To learn more about this exciting designation, visit sbwhaleheritage.org.
December marks the third complete season of our Whale Safe operations in Southern California and the first complete season of Whale Safe operations in the San Francisco region. Below is a full recap of whale and ship data collected by our Whale Safe Systems throughout the Vessel Speed Reduction (VSR) season from May 1 through December 15 (note: data does not include information for the Monterey Bay expansion area).
The Whale Safe system uses visual and acoustic detections to show when blue, humpback, and/or fin whales are present, and uses a species distribution model and daily oceanographic conditions to determine where blue whales were likely to be in each region. Every day, this information is integrated into a whale presence rating (low, medium, high, very high) for each region. Whale Safe also uses AIS data to determine which vessels and companies best abide by voluntary speed recommendations throughout the season. To read more about how this tool works, visit our methodology page.
Southern California Overview
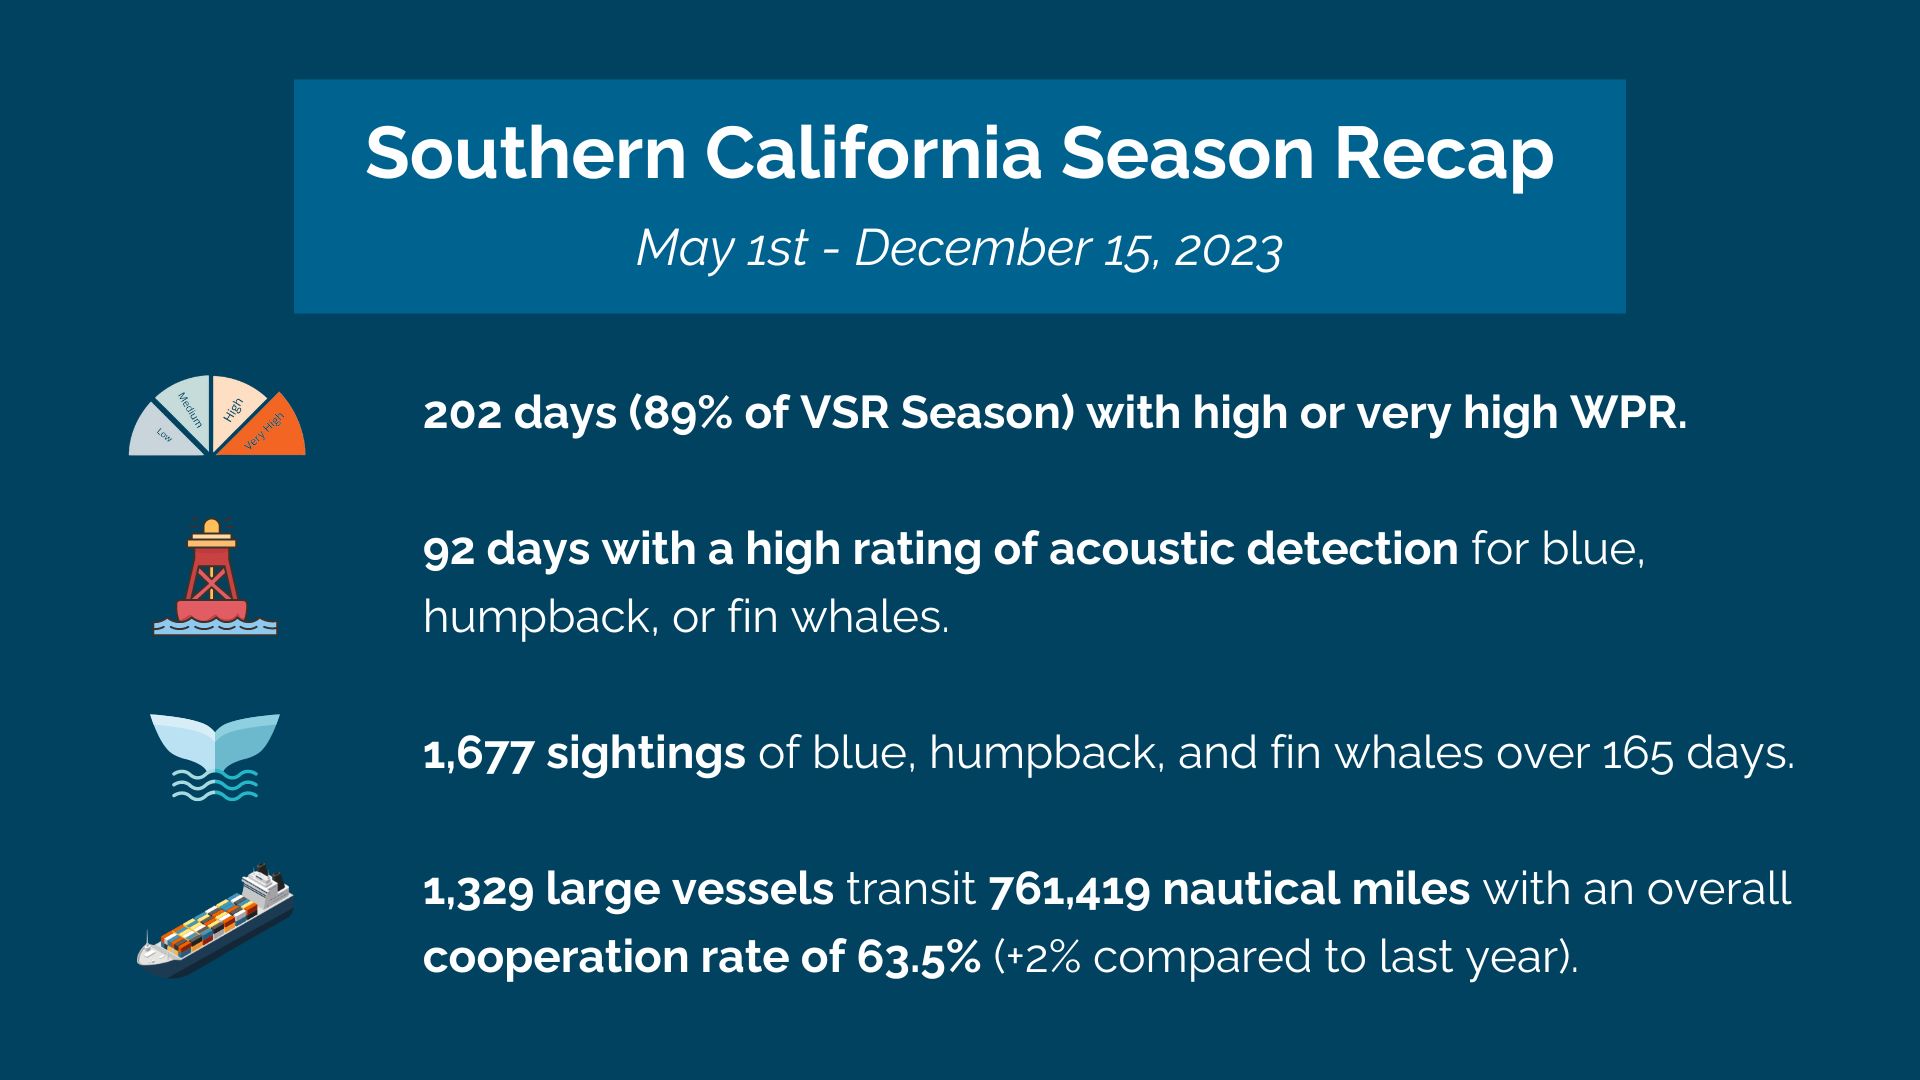
It was a very busy whale season in the Southern California region this past season. The Vessel Speed Reduction (VSR) season spanned 228 days and of these there were 202 days (89%) where the whale presence rating was “high” or “very high” – with 61 days considered “very high” and 141 days considered “high”. That was based on:
A total of 1,677 reported sightings of blue, humpback, and fin whales over 165 days collected by trained naturalists aboard Island Packers, Condor Express, SB Whale Watch and collected by research partners.
Our acoustic detection system also reported 92 days with “high” ratings for blue, humpback, or fin whales. Our acoustic detection system transmits data from the moored buoy system in 15-minute summary periods. A high rating indicates the proportion of 15-minute summary periods (daily call rate) with confirmed acoustic detection for that species was above a species-specific threshold (see Methodology Page for more information).
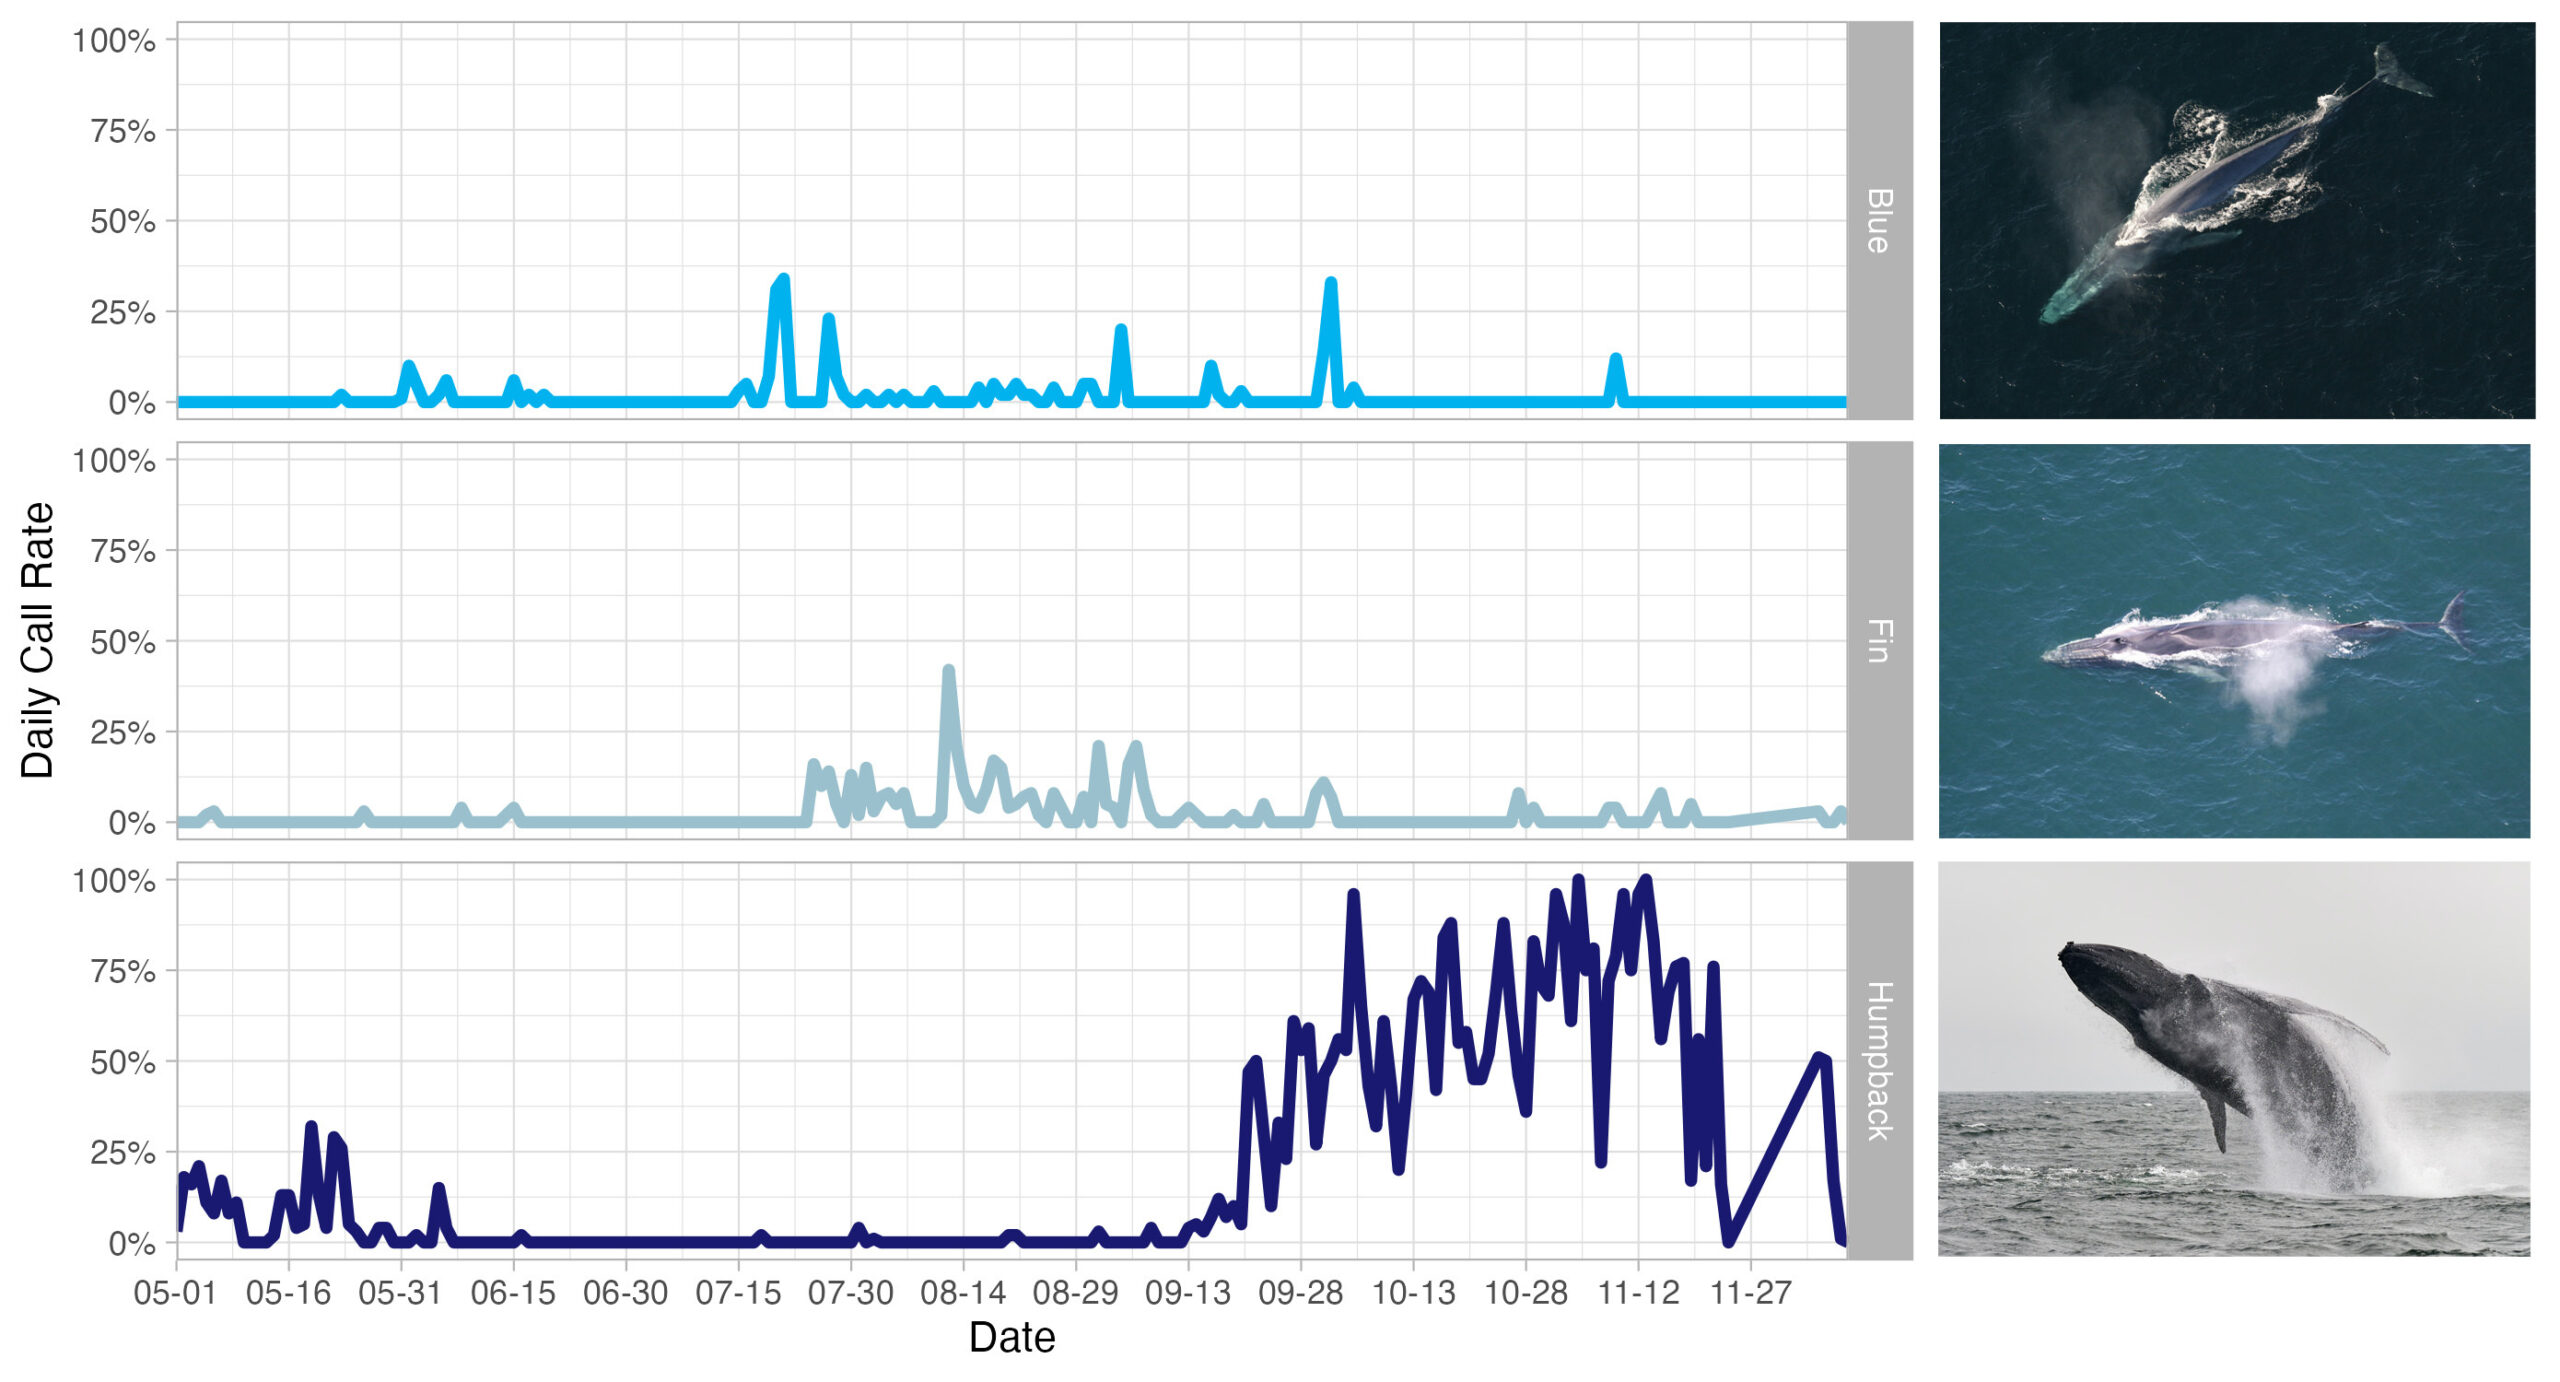
Overall, there were 1,329 large vessels (>300 tons) that transited a total of 761,419 nautical miles with an overall cooperation rate of 63.5% (a small increase from last year’s cooperation rate of 61.6%).
San Francisco Region Overview
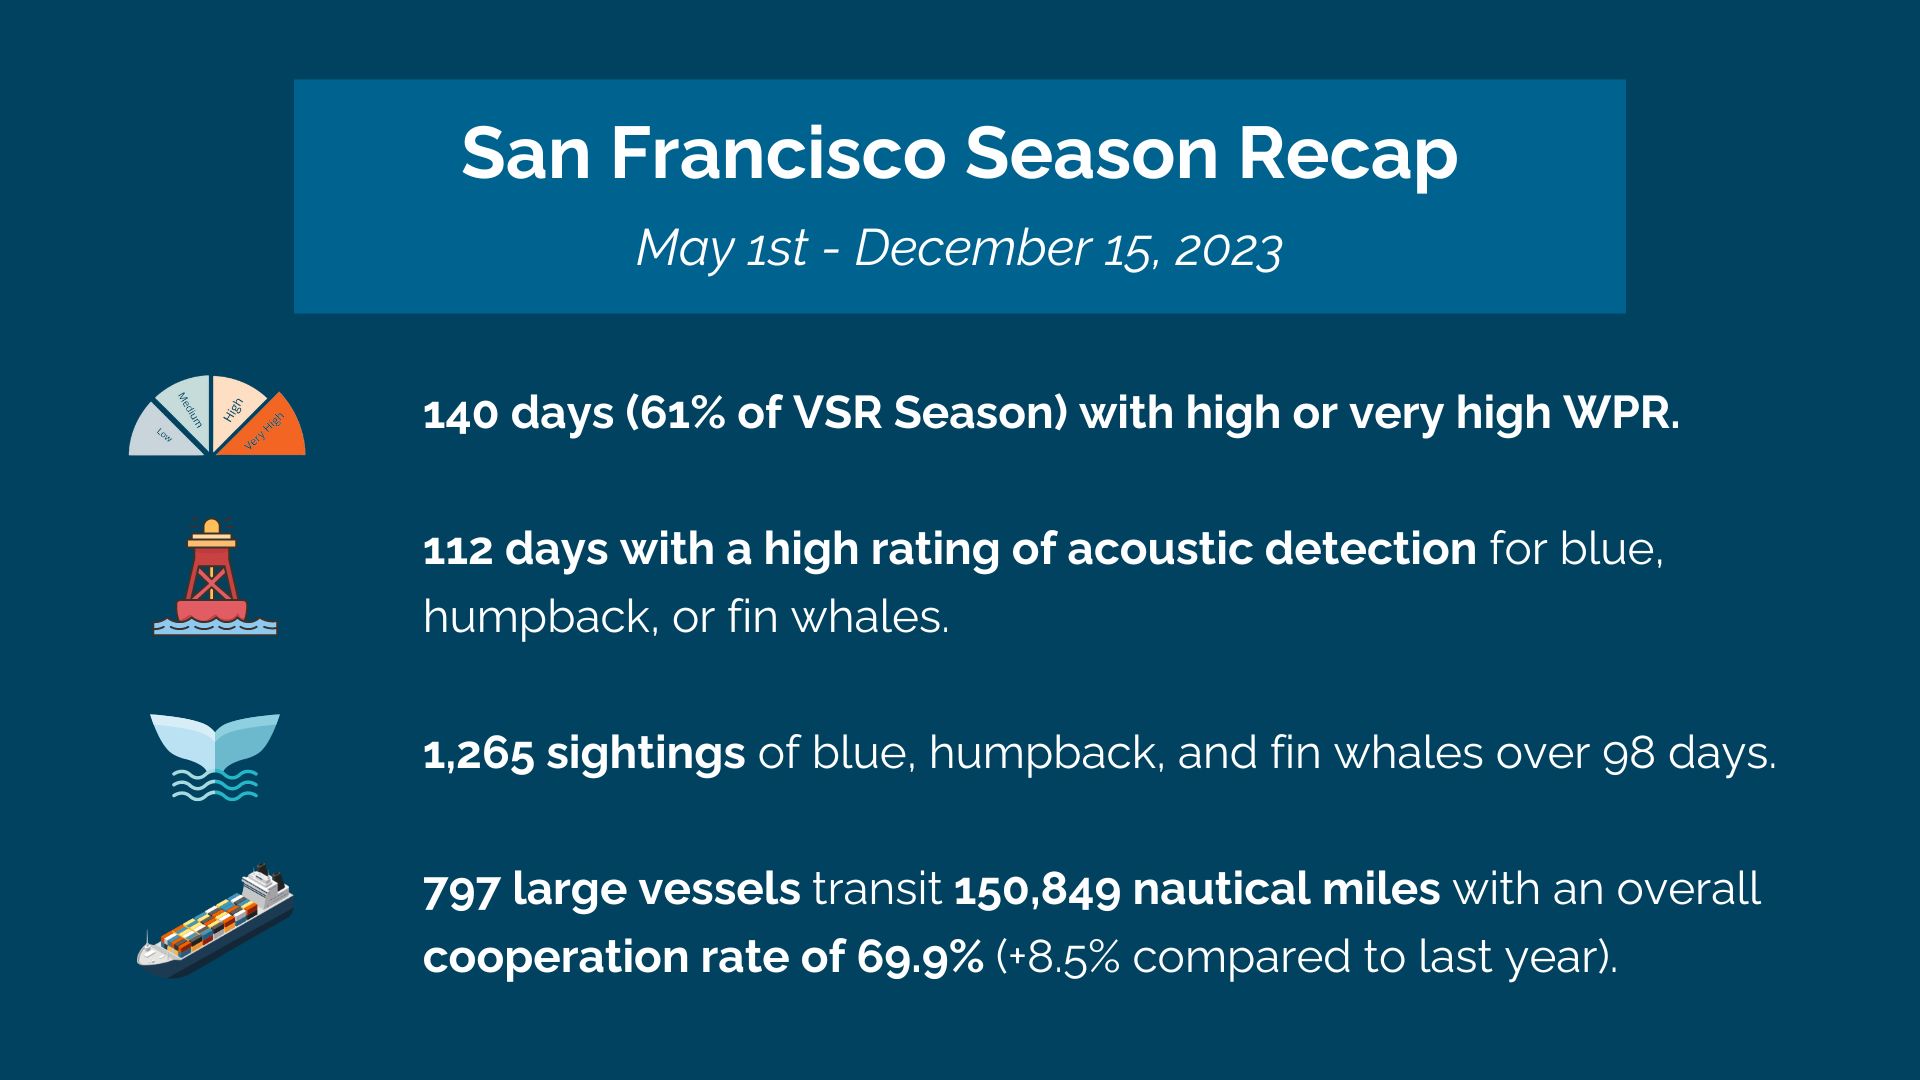
We launched the San Francisco system in September of 2022 and unfortunately, this past fall the San Francisco acoustic buoy had a wild ride when it went adrift–likely from being struck or entangled by a passing vessel. We successfully recovered the buoy, but did not have acoustic data for the San Francisco region from the end of September onward for the 2023 season.
Overall, the VSR season spanned 228 days. Of these there were 140 days (61%) with a whale presence rating of “high” or “very high”, with 97 days considered “very high” and 84 days considered “high”. That was based on:
A total of 1,265 reported sightings of blue, humpback, and fin whales over 98 days collected by research partners including The Marine Mammal Center and Point Blue Conservation Science.
Despite the acoustic system being offline September 29-December 15, there were 112 days of “high” ratings of acoustic detections for blue, humpback, or fin whales. Again, our acoustic detection system transmits data from the moored buoy system in 15-minute summary periods. A high rating indicates the proportion of 15-minute summary periods (daily call rate) with confirmed acoustic detection for that species was above a species-specific threshold (see Methodology Pagefor more information).
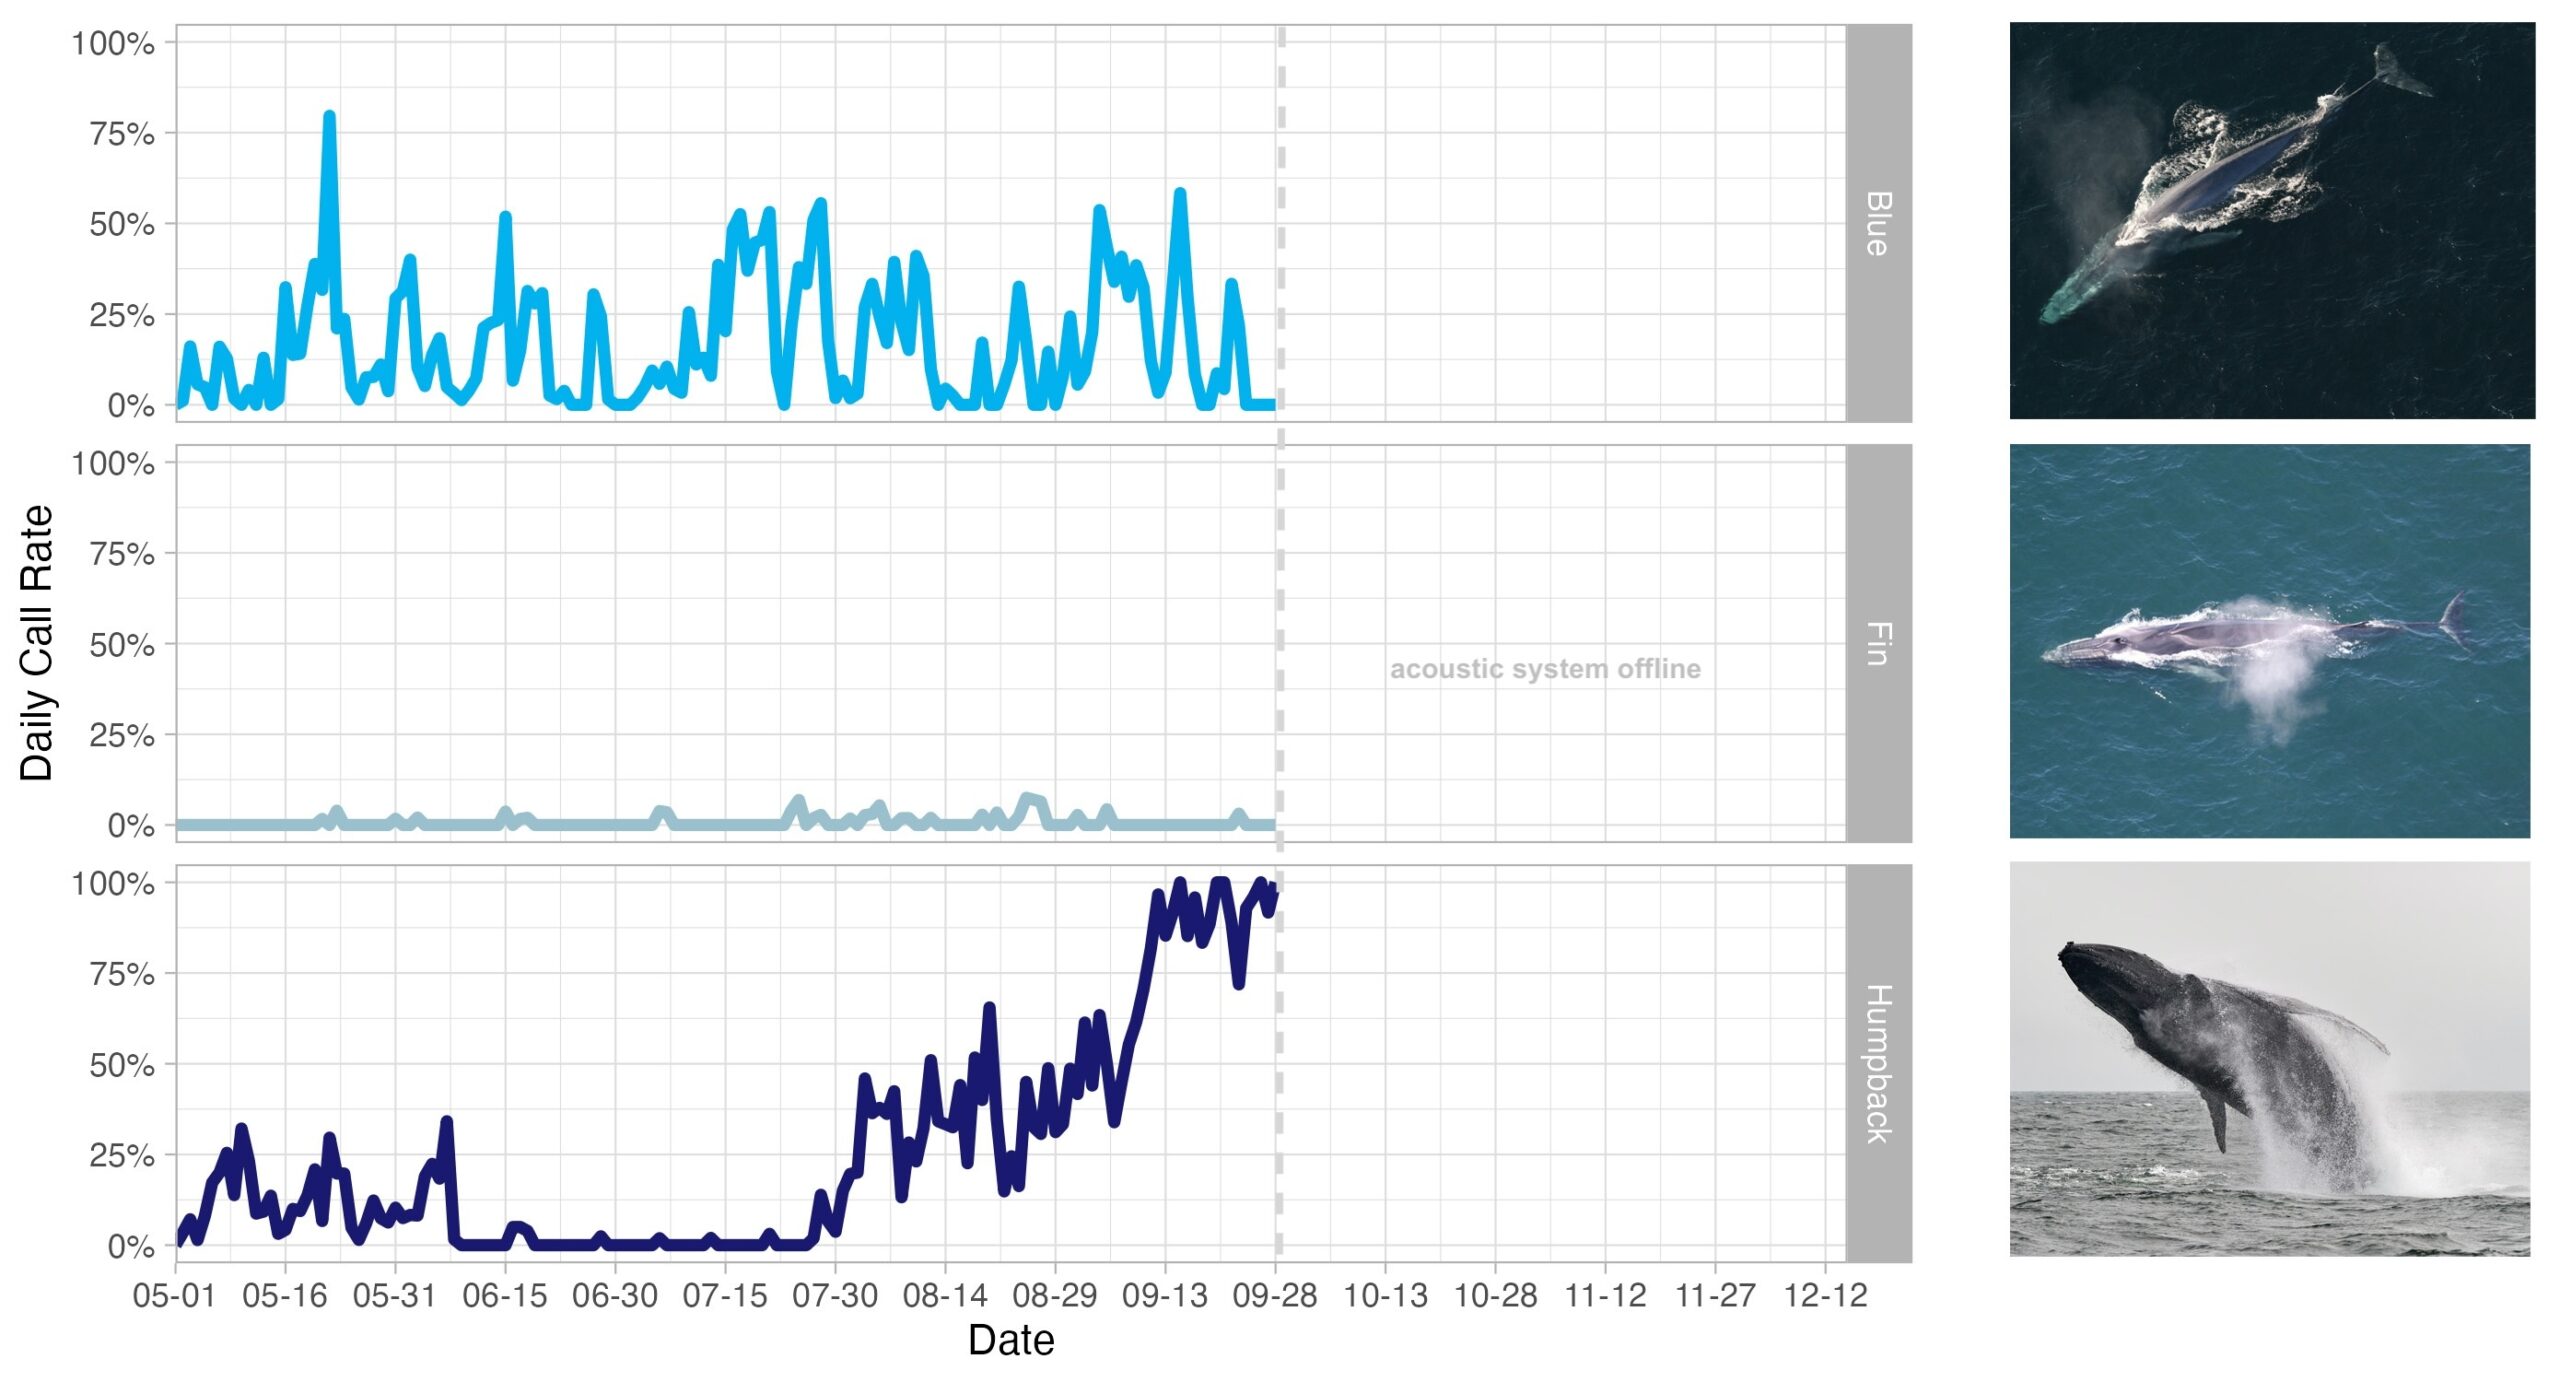
Overall, there were 797 large vessels (>300 tons) that transited a total of 150,849 nautical miles with an overall cooperation rate of 69.9% (a large increase from last year’s cooperation rate of 61.4%).
Aggregated Ship Analytics
In addition to providing whale detections and predictions, our Whale Safe tool displays operator report cards that provide analytics for companies that transit the vessel speed reduction zones in both Southern California and San Francisco. Below are the top 10 companies by fleet distance during the 2023 VSR season in both regions:
Top 15 Operators by Total Distance for 2023 (excluding passenger and towing/pushing):
Operator Total Distance 2023 (nautical miles) Grade 2023 Grade in 2022 Maersk A/S 43,960 A, 83.2% A, 81.3% CMA CGM 43,368 A, 95.3% B, 79.4% Ocean Network Express 41,981 A, 88.8% B, 79.2% Chevron Shipping Co 39,625 B, 74.6% B, 73.5% MSC 32,284 A, 95.1% A, 92.1% Evergreen Marine Corp 30,213 A, 80.5% B, 74.6% NYK Line 28,641 A, 86.1% B, 83.6% Yang Ming Marine Transport 26,597 A, 93.4% A, 91.7% COSCO Shipping Lines 24,124 B, 78.5% B, 86.3% Kawasaki Kisen Kaisha 22,827 B, 70.6% B, 74.9% Matson 17,167 B, 64.3% F, 17.5% Orient Overseas Container Line 14,829 A, 94.2% A, 95.9% Mitsui OSK Lines 13,044 B, 73.4% B, 79.7% Pasha 13,030 F, 13.7% F, 16.5% HMM Co 13,015 C, 43.1% B, 72.2%
Upcoming Year
We also have some exciting news–we recently launched Whale Safe North America. The new tool now provides real-time ship data analytics across all slow speed zones put in place to protect endangered whales from ship strikes.
The tool expands the vessel analytic power of Whale Safe beyond the San Francisco and Southern California VSR zones to monitor and report on shipping companies’ performance across all ship-strike slow speed zones within North American waters, which currently includes zones along the US Eastern seaboard and the Gulf of Saint Lawrence in Canada. Visit na.whalesafe.com to explore the new tool, watch our launch video above, or check out the recording from the webinar we hosted in April.
Stay Updated
Want to stay up-to-date on Whale Safe whale presence updates and monthly shipping report cards? Sign up for our daily, weekly, or monthly updates on the “Get Involved” section of the Whale Safe website. You can also access the daily whale data via our Twitter feed, @whalesafe_sc & @whalesafe_sf, or through an Application Programming Interface (API) (email us at bosl-whalesafe@ucsb.edu to find out more).