2024 Year in Review: A Look Back at Whales & Ships in the Santa Barbara Channel & San Francisco Region
The waters off California’s coast host one of the most productive marine ecosystems in the world, drawing in large whales to feed on the abundant krill and small fish. However, these same rich waters are also home to some of the busiest shipping ports in the United States. Major shipping lanes, particularly in the Santa Barbara Channel and approaches to San Francisco Bay, directly overlap with important areas for endangered blue, fin, and humpback whales. This overlap creates a significant risk of ship strikes (collisions between vessels and whales) that can result in serious injury or death to these protected species.
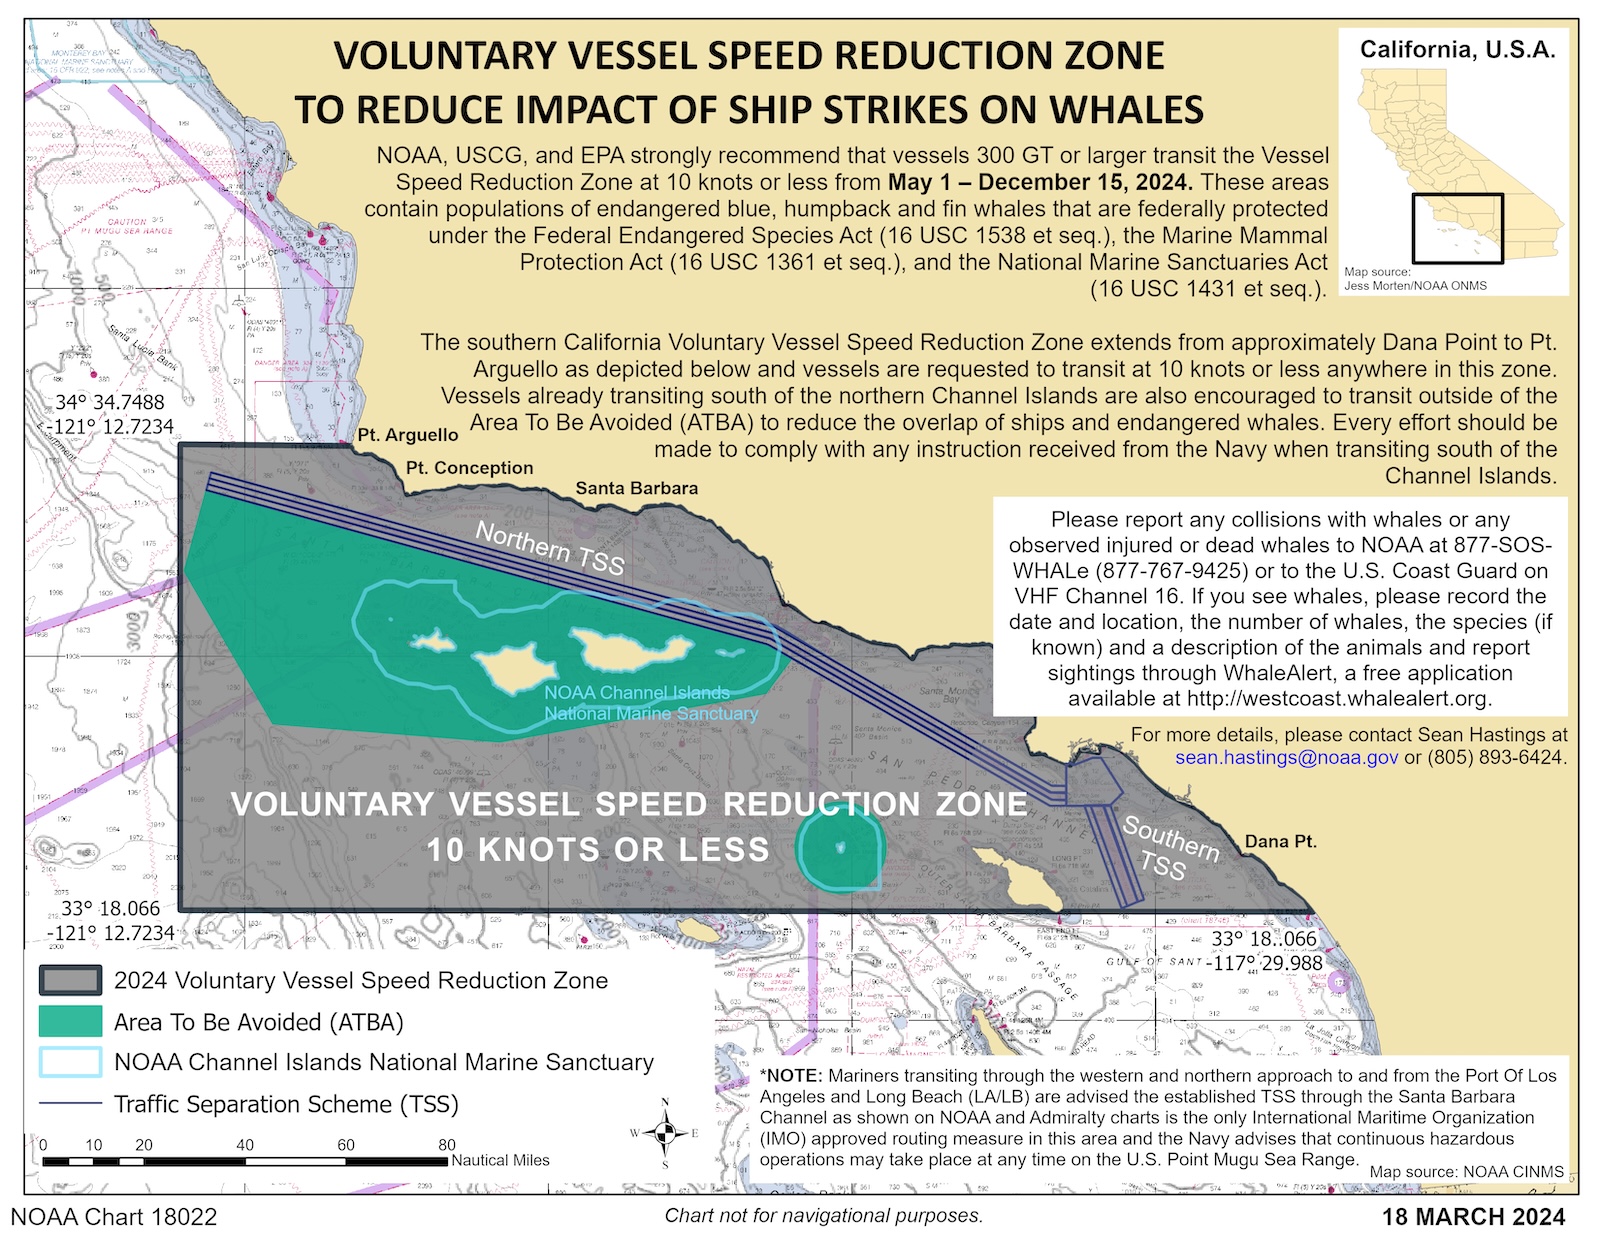
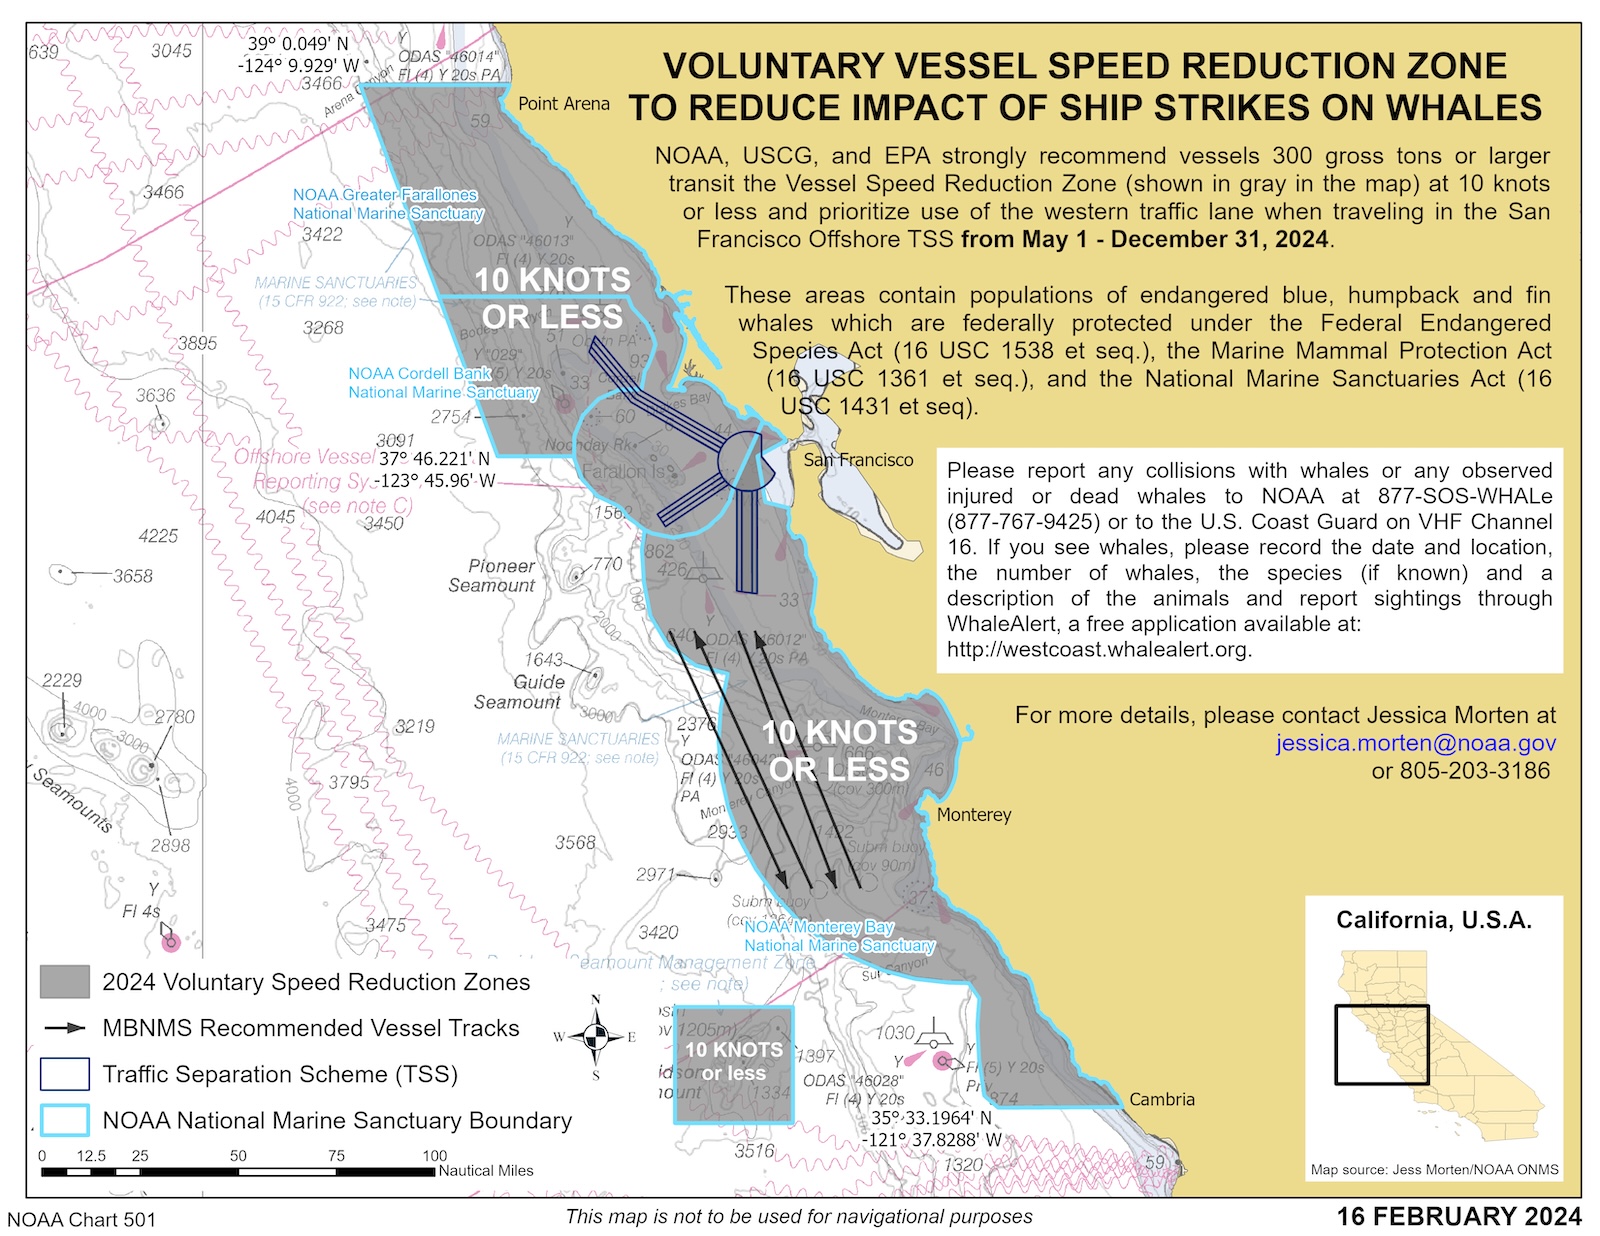
To address this challenge, NOAA, US Coast Guard, and EPA implement the Vessel Speed Reduction (VSR) program, which requires large vessels to slow to 10 knots or less in designated zones where whales are known to feed and migrate. Research shows this speed reduction dramatically decreases both the likelihood and severity of ship strikes, helping to balance maritime commerce needs with whale protection. The Vessel Speed Reduction program typically runs from May through December, however, this season the zones were extended through January 15, 2025 due to unusually high numbers of humpback whales remaining in California waters to feed.
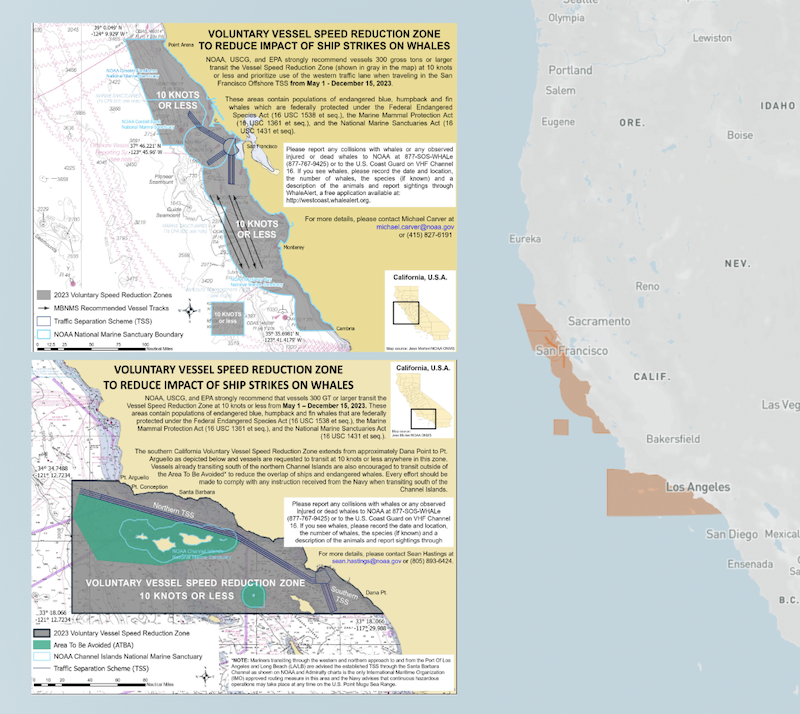
Vessel Speed Reduction zones:
Our Whale Safe system helps encourage cooperation with these vessel speed zones using high-tech ocean sensors, big data models, community science, and ship tracking data to provide mariners with the latest information on whale presence in these busy shipping areas. This year marks its fourth season of operations in Southern California and second season in the San Francisco region. Whale Safe uses visual sightings, acoustic whale detections, and a predictive model to generate daily whale presence ratings (low, medium, high, very high) for each region, while also tracking vessel and company cooperation with the voluntary speed recommendations through AIS data analysis.
Due to hardware failures, our acoustic system was unfortunately offline for the majority of the Vessel Speed Reduction season this past year. Despite missing this data stream, we still detected a lot of whales by using sightings data and a blue whale predictive model. Based on these two data streams, we calculated 132 days (50% of VSR Season) with high or very high Whale Presence Rating in the San Francisco region. In Southern California, there were 172 days (66% of VSR Season) with high or very high Whale Presence Rating.
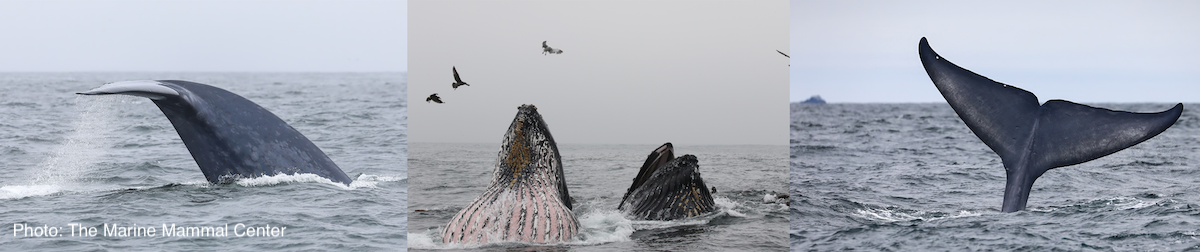
Over the entire season, there were 1,199 humpback whale sightings, 137 blue whale sightings, and 29 fin whale sightings recorded in the Greater Farallones and Cordell Bank national marine sanctuaries in the San Francisco region. In the Santa Barbara Channel in Southern California there were 1,018 humpback whale sightings, 466 blue whale sightings, and 73 fin whale sightings. The summer proved exceptional for blue whale watching, with naturalists documenting as many as 30 individuals during a single vessel trip. Whale sightings are collected by Channel Islands Naturalist Corps and naturalists aboard Island Packers, Condor Express, and SB Whale Watch, and collected by research partners including The Marine Mammal Center, Point Blue Conservation Science, and California Marine Sanctuary Foundation using Whale Alert and Spotter Pro cell phone applications, which were developed by Conserve IO. Since multiple boat trips occurred on some days and whales can remain in the same area, individual whales may have been counted more than once in the season totals.
Sightings May 1, 2024 – January 15, 2025:

The Whale Presence Rating is also calculated using data from a predictive blue whale model called WhaleWatch 2.0 that was developed by scientists at University of California Santa Cruz, Oregon State University, University of Washington, and NOAA Southwest Fisheries Science Center. The predictive tool provides information daily on suitable blue whale habitat in both regions, showing whether blue whales are likely to be in the shipping lanes each day based on current environmental conditions, such as ocean temperature and productivity. Overall, there were 89 days where the ocean conditions were favorable for blue whales (orange to red on the map below) in Southern California and 75 days in the San Francisco region.
WhaleWatch 2.0:
Maritime traffic continues to grow significantly in California’s coastal waters, reflecting the region’s critical role in global trade. In the Southern California Vessel Speed Reduction zone, which includes shipping lanes to the Ports of Los Angeles and Long Beach (one of the world’s busiest port complexes), we recorded over 1,778 large vessels traveling more than one million nautical miles with an overall cooperation rate of 64%. The San Francisco and Monterey Vessel Speed Reduction zone had an even higher cooperation rate of 72% with over 1,100 large vessels traveling 300,000 nautical miles through this zone. Both regions saw an improvement in overall cooperation rates compared to last year, demonstrating the shipping industry’s growing commitment to whale protection measures. Notably, ten of the fifteen most active vessel operators received an ‘A’ grade for their cooperation, showing strong leadership in prioritizing whale safety.
Top 15 Operators by Total Distance
| Operator | Total Distance | Grade | Cooperation Rate |
| CMA CGM | 56,325 | A | 94% |
| MSC | 46,031 | A | 92% |
| Ocean Network Express | 45,371 | A | 90% |
| Maersk A/S | 42,046 | A | 87% |
| Yang Ming Marine Transport | 37,961 | A | 88% |
| Evergreen Marine Corp | 33,190 | B | 69% |
| NYK Line | 28,305 | A | 92% |
| COSCO Shipping Lines | 28,178 | A | 85% |
| Orient Overseas Container Line | 23,803 | A | 89% |
| Kawasaki Kisen Kaisha | 22,827 | B | 64% |
| HMM | 20,789 | C | 41% |
| Matson | 17,230 | A | 83% |
| Chevron Transport Corp | 16,942 | B | 76% |
| Pasha Hawaii Holdings | 15,834 | F | 9% |
| Hyundai Glovis Co | 15,021 | A | 80% |
These cooperation grades are calculated using Automatic Identification System (AIS) data, a GPS-like tracking system required on large vessels. The Whale Safe platform analyzes the AIS data to track vessel movement throughout the speed reduction zones to calculate the proportion of miles traveled at the recommended speed of 10 knots or less. For detailed information about grade calculations, please visit our methodology page.
Beyond the publicly available grades on Whale Safe, we expanded our impact this season through our partnership with the Protecting Blue Whales Blue Skies program. This collaboration allowed us to provide participating companies with detailed reports tracking their fleets’ performance throughout the season. Protecting Blue Whales Blue Skies is a comprehensive verification and recognition program that quantifies multiple environmental benefits of vessel speed reduction, including emissions reduction, noise decrease, and ship strike prevention. Through this partnership of federal and local government agencies, foundations, and environmental non-profits, participating companies receive recognition for their commitment to responsible shipping practices, encouraging broader adoption across the industry. See the 2025 season results from the Protecting Blue Whales Blue Skies program here.
Whale Safe’s success relies on collaborative partnerships like Protecting Blue Whales Blue Skies, along with our dedicated technology and research partners who ensure the continued operation of our monitoring system. We are also grateful for the leadership of vessel operators that are prioritizing whale safety by slowing down. Thank you for another successful season of whale protection along the California coast. Stay tuned for more exciting developments in our ongoing efforts to promote safer waters for whales in the year ahead!